


REAL ESTATE NEWS & EDITORIAL
Summer 2017
From Dan Mihalovich, Principal of Mihalovich Partners and Founder of The Space Place®
If you're in search of intelligent life in the brokerage community... please enjoy this Editorial with my compliments.
In this Issue:
- Tax March Day (photos), San Francisco
- Stats Don’t Lie: Bloom is Off the Rose
- View to a Thrill
- The Great (Office Market) Fire Subsides
- Our Clients Love Using griddig – CRE’s First Live Marketplace for Office Leasing Deal-Making
- 1Q 2017 Top Leasing Transactions
- If Your Lease Will Expire Within The Next Three Years...
- Vacancy Rates: Are Your Options Fading?
- Five Brokerage Firms / 9M SqFt of Space / 430 Buildings Listed: How Do You Spell "Conflict of Interest"?
The last 10 years of our pearls of wisdom:
- Editorial Archives
- Our 40 letters of recommendation
- Our Case Studies (Calif Academy of Sciences; Bar Assn of San Fran; WSGR)
- What Makes Us Different? Tenant Services.
MIHALOVICH PARTNERS
505 Montgomery Street, Suite 1100
San Francisco, CA 94111
License # 01376000
Office: 415-434-2820
Cell: 415-999-9244
Email: dan@TheSpacePlace.net
Web: www.TheSpacePlace.net
Twitter: @MihalovichCRE
Thank You to Our Clients & Friends
We believe that representing tenants – and only tenants – is a noble cause, our specialty for over thirty years. We greatly appreciate our clients’ confidence and kind words about us, our level of advocacy and enthusiasm to negotiate aggressively... and mind the details while guiding the leasing process. Here’s to a spectacularly successful 2017.


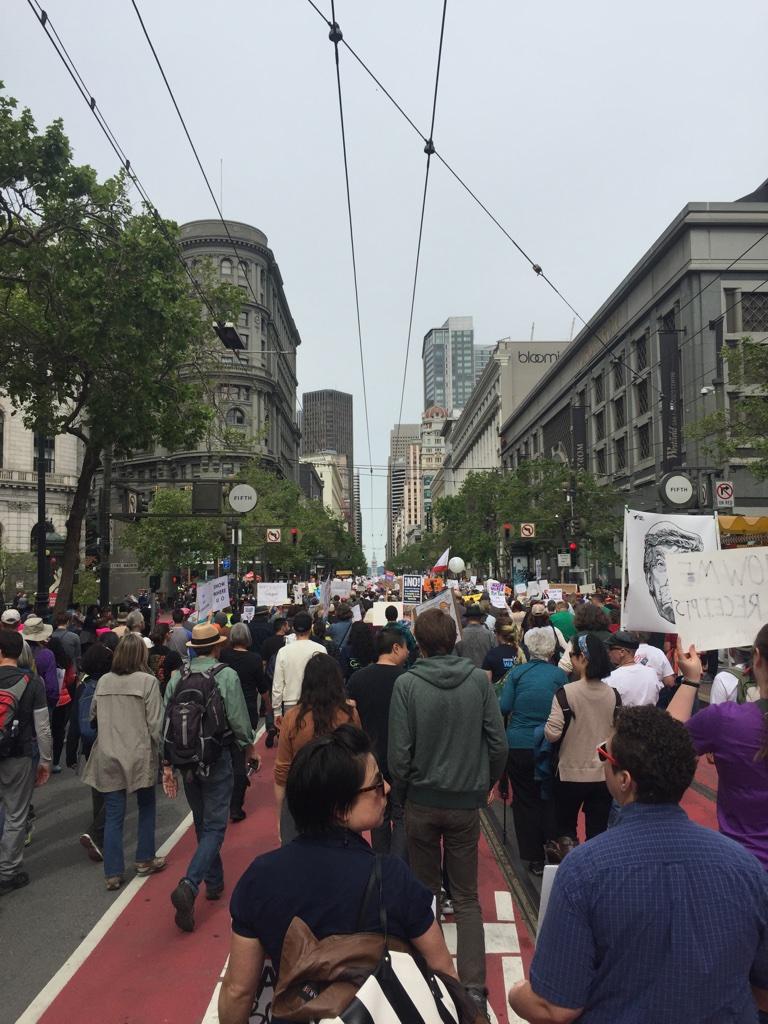
Tax March Day (photos), San Francisco
Tax March San Francisco:

Stats Don’t Lie: Bloom is Off the Rose
The Registry just published an article about the SF Bay Area office market — in which our opinion is highlighted. “The statistics don’t lie — the bloom is off the rose,” expressed Mihalovich. “We’ve had four consecutive quarters of declining absorption of space. There’s 15 million square feet of space on the market in San Francisco with more coming online daily. The markets are still priced as though there’s no tomorrow. The positive impression of the market is because of brokerage companies catering to the landlord community.”
San Francisco, aka Camelot
- 14.6 M square feet available (direct + sublease). Up from 13.3.
- 2.4M sf is sublease (16% of total). Up from 1.9 (14%).
- 12% total inventory is available
- 5.9M sf under construction (will add 5% to total inventory). Up from 4.1M.
- Market size 116M sf
- Total Net Absorption, Q1: NEGATIVE NET ABSORPTION: <670,000> sf.
San Mateo County
- 6.8 M square feet available (direct + sublease). Up from 5.4.
- 1.4M sf is sublease (21% of total)
- 13% total available
- 2.3M sf under construction (will add 5% to total inventory). Up from .8M
- Market size 51M sf
- Total Net Absorption, Q1: 403,000 sf.
Alameda/Contra Costa Counties:
- 12.1M square feet available (direct + sublease)
- 1.3M sf is sublease (11% of total)
- 11% total available
- 1.1M sf under construction (will add <1% to total inventory). Up from .7M.
- Market size 111M sf
- Total Net Absorption, Q1: 94,000 sf.
After reading through this Market Editorial, please see our collection of educational articles we’ve written to our tenant community.
View to a Thrill
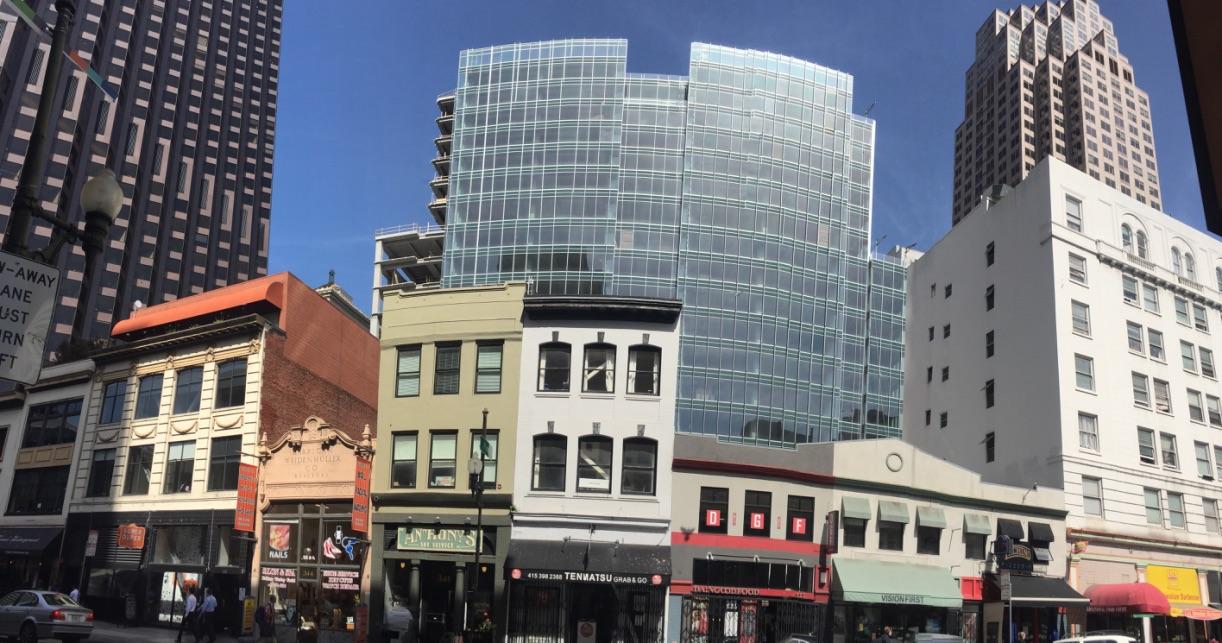
This decade will mark a seismic change in the City’s landscape, no pun intended. Massive construction abounds and will affect daily living for several years to come: Think Transbay Center (Salesforce Tower, etc.); 181 Fremont; Park Tower, 250 Howard; Oceanwide Center; The Exchange on 16th; Treasure Island and its new Ferry Building; the Naval Shipyard; 5M Project at 5th & Mission; the Warriors’ Chase Center; and Parkmerced, to name just a few! All of this building is taking place outside NOMA – where we’ve officed for over thirty years. But NOMA’s growth has exploded, too, primarily driven by tech companies and the arrival of WeWork – already one of the largest tenants in Camelot.
The photo, above, captures the transformation of the hood during my 30-year career, from my earliest 16 years as Director of Office Leasing at Cushman & Wakefield in 555 California Street, BofA World HQ Building on the left; which offered me a view for all those years over the hole in the ground behind the Russ Building – which now hosts Lincoln’s newly developed 350 Bush Street; to 333 Bush on the right, developed by the Canadians (RIP) and largely filled via a lease/equity deal with one of our nation’s largest law firms...Heller Ehrman (RIP).
Whether you’re a development fan or not (is “green development” an oxymoron?), the fact is that San Francisco has risen to become the world’s leading incubator for new ideas, businesses, talent, trends, traffic, food(ies), and flame-outs. If it’s ground-breaking, big, expensive, risky and wild....it’ll happen here.
Does the market make sense? Well, eventually fundamental supply/demand economics speak up. Does the market require that your business exist? Let the Startup Community answer the question. We’re waiting....In the meantime, gentrification is occurring throughout our region and it’s riskier and more expensive than ever in history to run a business here.
Aside from the City’s tech giants Google, LinkedIn(MS), Uber, Airbnb....Amazon recently expanded its presence by becoming the new anchor tenant at 350 Bush Street. Its subsidiary, Twitch, is in my view a cultural wake-up to building ownership everywhere. In their words, here’s what they do:
“Founded in June 2011, Twitch is the world’s leading social video platform and community for gamers, video game culture, and the creative arts. Each day, close to 10 million visitors gather to watch and talk about video games with more than 2 million streamers. We invite you to join the millions of people who come to Twitch to stream, view, and interact around these shared passions together.”
That’s six years ago. Each time big tech expands in the City, landlords and their brokers envision more coming. In the meantime, non-venture-backed tenants are trying to deal with a very different reality: making money the old fashioned way isn’t profitable for most. Our “deep throat” VC author continues to assist us to understand the VC landscape....and how it may impact office leasing trends. And we note that we’ve seen several consecutive quarters of declining leasing activity. The markets do work. We’re here to help you through your next lease negotiation.
It’s been a thrill to ride the wave of San Francisco office leasing for the past thirty years. Thirty to go!
The Great (Office Market) Fire Subsides

1906 office leasing market. Where there was fire, now just smoke.
Dear Office-Tenant Community: Technology companies -- clearly the driving demand factor in office markets around the country -- get their lifeblood from venture capital. So, where are we in the VC cycle NOW? If the flow of VC slows, crawls or evaporates, will the office markets collapse --- and if such a scenario is likely in the foreseeable future, when might this occur? We asked for an update (from last quarter) from a local brainbox – a venture capitalist whose tenured company has more than $1B invested in public and private tech. We agreed not to disclose the VC’s name, but here’s a direct quote:
“...cautiously optimistic in the near term….while more bearish in the medium to long term.”
“In our last missive we noted a dramatic shift in public equity markets following the election, a shift from a late cycle fed-driven market to one resembling an early cycle market. This was reflected in outperformance of small-mid cap stocks and cyclical sectors given optimism around the likelihood that more accommodating fiscal policy could drive economic growth and extend the current long-lived business cycle.
While strong domestic public equity market performance continued in 1Q, the drivers of this performance shifted. After under-performing following the election due to sector rotations, tech stocks (and particularly large cap tech stocks) rebounded sharply. Apple (AAPL), Amazon (AMZN), and Facebook (FB) alone contributed nearly a third of the S&P 500s 6% return.
Tech IPOs have also returned, and while performance has been a bit mixed the pace of deals is certainly outdoing 2016. 9 companies have come to market in 2017 YTD, compared to one company last year (https://techcrunch.com/2017/05/01/2017-tech-ipos-are-on-a-tear-compared-to-last-year/). Notable deals include Snapchat, Yext, Okta, Mulesoft, and Cloudera (the latter three being headquartered in the Bay Area). This is generally positive for the Bay Area leasing environment, given the heightened liquidity of these companies and the open IPO window which may encourage some of their brethren to follow suit.
VC funding rebounded sequentially from 4Q 2016, +15% q/q. Year over year declines also continued to moderate with 3Q'16/4Q'16/1Q'17 declines of -29%/-16%/-12% y/y. It is important to remember that these declines are off of massive peak levels. In absolute dollars funding remains robust, with $16.5B invested in the quarter (Source: Pitchbook). Again, this is a positive indicator for the Bay Area office leasing environment insofar as one believes venture funding is a driver to the leasing environment. Yes, the dollars have moderated from peak levels, but the trend has improved from 3Q'16 and companies remain well funded.
While many of the aforementioned indicators appear positive, we would still caution against outright exuberance. As we mentioned in our last note, the current economic expansion is nearing 8 years. This is already the third longest domestic economic expansion since 1900, with only 1961-1969 and 1991-2001 expansions lasting longer. We would also note that certain cyclical indicators are still flashing yellow following the election; notably lower end consumer credit is deteriorating as evidenced by commentary from the management teams of companies such as Ally Bank (ALLY), Capital One (COF), and Synchrony Financial (SYF).
We would also argue that geopolitical risk is high between continued tensions in the Middle East, rising tensions in the Asia-Pacific, and a rising global tide of populism (at the time of this writing the French election run-off is a week away). We are also skeptical that the administration will be able to accomplish much on the fiscal policy stand-front. Furthermore, we worry that even if the administration is successful any significant growth acceleration could (a) potentially contribute to structural issues with the economy (heavy debt burden) and (b) likely be met with tightening from the fed. Aggressive tightening after overheating is historically one of the more prevalent cycle killers. As such, I remain cautiously optimistic in the near term (assuming we do not see a geopolitical tail risk type event), while more bearish in the medium to long term.”
Our job at Mihalovich Partners is to advocate for our clients -- tenants -- in office leasing negotiations. Analyzing and understanding market dynamics makes us more valuable than our competitors at the negotiating table. Think about our representing your interests in your next office leasing negotiation.
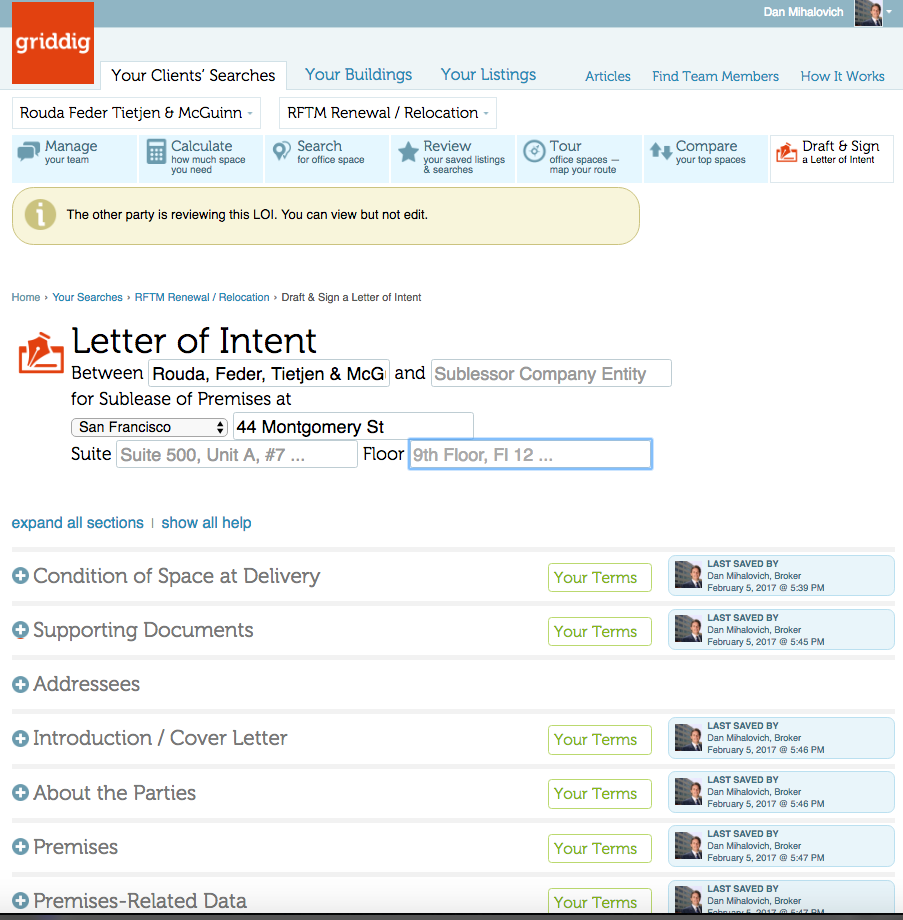
While you're contemplating, check out our industry's first live marketplace for office leasing deal-making: griddig. Public office space listings, free search. Negotiate and fully execute Letters of Intent on the platform without making mistakes. It's online transparent collaboration, team-driven.
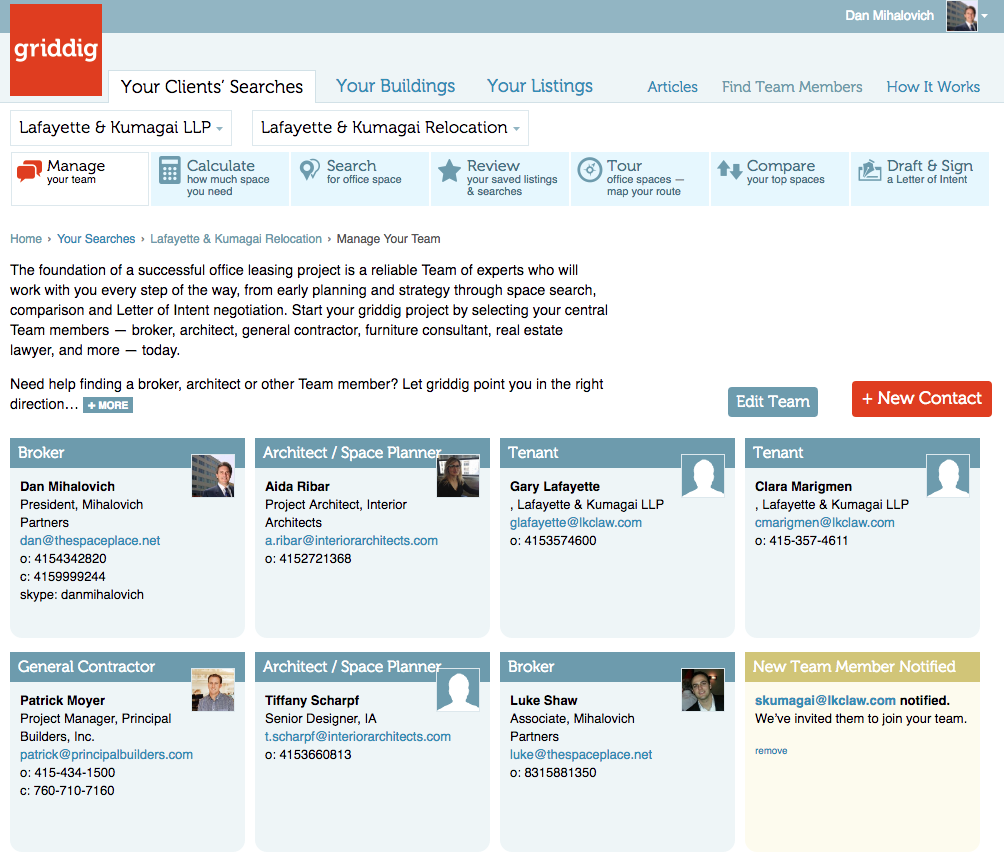
Our Clients Love Using griddig – CRE’s First Live Marketplace for Office Leasing Deal-Making
It's the fastest, most collaborative, fool-proof way to speed through deal-making and get it right the first time. No surprises. No mistakes. The shortest distance to decisions and closed deals.
Try it FREE. griddig improves the entire industry's performance -- join Landlords, Tenants, Brokers and Service Providers in the LIVE MARKETPLACE and start your next deal today. Sneak peek below...
1Q 2017 Top Leasing Transactions
| SAN FRANCISCO | ||
| Tenant | Address | Sq Ft |
|---|---|---|
| Slack | 500 Howard | 222,000 |
| 121 Spear | 166,000 | |
| Accenture | 415 Mission (Salesforce Tower) | 101,000 |
| WeWork | 201 Spear | 65,000 |
| WeWork | 650 California | 60,000 |
| RocketSpace | 123 Mission | 56,000 |
| SAN MATEO COUNTY | ||
| Tenant | Address | Sq Ft |
| Amazon | 2100 University | 214,000 |
| Chan-Zuckerberg Initiative | 2075 Broadway, Redwood City | 102,000 |
| - | 130-150 Shoreline, Foster City | 55,000 |
| Gunderson Dettmer | 550 Allerton, Redwood City | 45,000 |
| - | 889 Winslow, Redwood City | 38,000 |
| EAST BAY COUNTIES (Alameda/Contra Costa) | ||
| Tenant | Address | Sq Ft |
| Blue Shield | 601 City Center, Oakland | 230,000 |
| VCOP | 1100 Broadway, Oakland | 108,000 |
| Service Now | 4305 Hacienda Business Park, Pleasanton | 25,000 |
| The Port Workspaces | 555 12th, City Center, Oakland | 24,000 |
| - | 2000 Powell, Emeryville | 23,000 |
If Your Lease Will Expire Within The Next Three Years...
or if there is another compelling reason to discuss your firm's office leasing situation, please call us. For qualified tenants, we offer the following pre-contract services:
- Free preliminary office lease and operating expense review;
- Free consultation to discuss project management, Team formation and project schedule;
- Market surveys and our specific tenant-driven leasing recommendations ; and
- Assistance in selection and coordination of all Team members throughout planning and negotiation phases.
Vacancy Rates: Are Your Options Fading?
Tenants should watch carefully to detect how and to what extent your field of options changes. Which size blocks of space are getting leased? Discussing vacancy and absorption rates can be confusing to some. What language makes sense to tenants? Tenants ask, "Tell me about my specific options. How many choices do I have?" Are your options fading, as a result of leasing activity? Review the chart, below, and let's discuss.
| HOW MANY BLOCKS OF SPACE ARE AVAILABLE FOR YOU? | San Francisco County | San Mateo County | East Bay Counties | ||||
|---|---|---|---|---|---|---|---|
| Q4’16 | Q1’17 | ||||||
| 5,000–9,999 sq. ft. | 281 | 298 | Call us for more info | ||||
| ▲ 6% | |||||||
| 10,000–19,999 | 155 | 185 | |||||
| ▲ 19% | |||||||
| 20,000–29,999 | 46 | 42 | |||||
| ▼ 11% | |||||||
| 30,000–39,999 | 28 | 28 | |||||
| 0% | |||||||
| 40,000–49,999 | 10 | 10 | |||||
| 0% | |||||||
| 50,000+ | 38 | 39 | |||||
| ▼ 3% | |||||||
You can request a free space survey, containing all direct and sublease space meeting your specific requirements. We can also provide building photographs, floor plans, leasing histories and more. To discuss your space needs in person, call 415-999-9244 or email dan@TheSpacePlace.net.
Five Brokerage Firms / 9M SqFt of Space / 430 Buildings Listed: How Do You Spell “Conflict of Interest”?
When we approach a prospective new tenant client, we tell them that we NEVER represent landlords, always avoiding this conflict of interest. So, which of our competitors—leasing firms—do the most landlord representation? Who’s marketing 75% of the space in San Francisco?
The top companies controlling the most space available are NOT landlords... Rather, they are office leasing brokerage firms acting with the landlord’s interest in mind. They are:
CBRE
JLL
Cushman & Wakefield
Colliers
Newmark, Cornish & Carey
These brokerage firms control over 75% of all listings and are beholden to more than 430 local landlords, paid to drive up rental rates and drive down concessions for tenants.
Since their allegiance is committed to so many landlords, how can they possibly represent YOUR interests—the tenant’s interests—objectively and aggressively?