


Market Insight Editorial & Advice to Tenants: 2Q2009
In this Issue:
- Editorial from Dan Mihalovich, Principal of Mihalovich Partners and Founder of The Space Place®
- San Francisco Market Overview
- Take Me Straight to the Numbers: San Francisco Bay Area Rental Rates. Supply/ Demand.
- Who Has the Most Space in San Francisco? Surprise…
Welcome to Our House.
Thanks for your time. We provide detailed advice and market information to commercial tenants at this site. It’s all about you, tenants, since you are our sole focus. We are an independent firm, built on my 27 years of experience negotiating leasing transactions for tenants in the San Francisco Bay Area.
Whether you are a client, prospective client, a “vendor” to the trade or a competitor, at least one thing is certain: This site has a tremendous following, where we’ve created an effective activist lobby for commercial tenants’ interests and tenants’ issues. Yes, we want to win you over to become our clients. But in any event, our body of content influences and helps to shape the marketplace in ways friendly to the plight of all tenants. To be an effective broker and negotiator, you’d better be able to prove your command of the economy and tenant issues. So, my record of advice is always in writing.
Take your time, tenants. Our site is easy to navigate. In addition to the market commentaries I write, you’ll notice that we’ve been endorsed by scores of architects, contractors, real estate lawyers and other professionals who’ve contributed educational articles to help you. We’re very eager to answer your questions, so please feel free to call me—especially if we can explore how we may assist you and your firm.
Dan Mihalovich, President, Mihalovich Partners.
Charging Batteries Down Under
 Sydney, Australia
On advice of counsel (my wife), I am giving all of our readers a healthy break from the bad news to discuss instead our summer trip to the “winter” in Australia. Our 19 year old son, regularly enrolled at Cal Berkeley, started his year-abroad program in Sydney earlier this year. Since he’ll be away through November—and we’d never been down under—we thought we’d better make the trek or forget what he looks like by the time December rolls around. We planned one week in and around the Sydney area; and one week in Surfers Paradise along the Gold Coast, close to Brisbane. It was a spectacular trip.
 The Mihalovich Family in Australia
My wife, daughter (starting Senior at Branson) and I took the 14-hour flight from San Francisco to Sydney in stride. It wasn’t as bad as anyone predicted. Our son picked us up at the airport in a car he’d purchased; this made his surfing ventures to Maroubra and surrounding stellar spots all the easier. Need I mention that we survived travelling in his car for a week? Sydney is incredibly gorgeous. I’m a San Francisco native, as is my wife, so we don’t take the beauty of SF Bay lightly. We have nothing on Sydney; it’s that breath taking.
We stayed right near Sydney Harbor, within two blocks of The Rocks, the historic landmark neighborhood where Sydney was born. All these years later, we heard that most Aussies were pleased to have the early prisoners land in Sydney rather than where they were originally intended: Atlanta, Georgia! The Rocks was chock full of restaurants, bars, music performances, friendly folks but no—repeat no—Fosters, mate! We didn’t see a can during our entire trip.
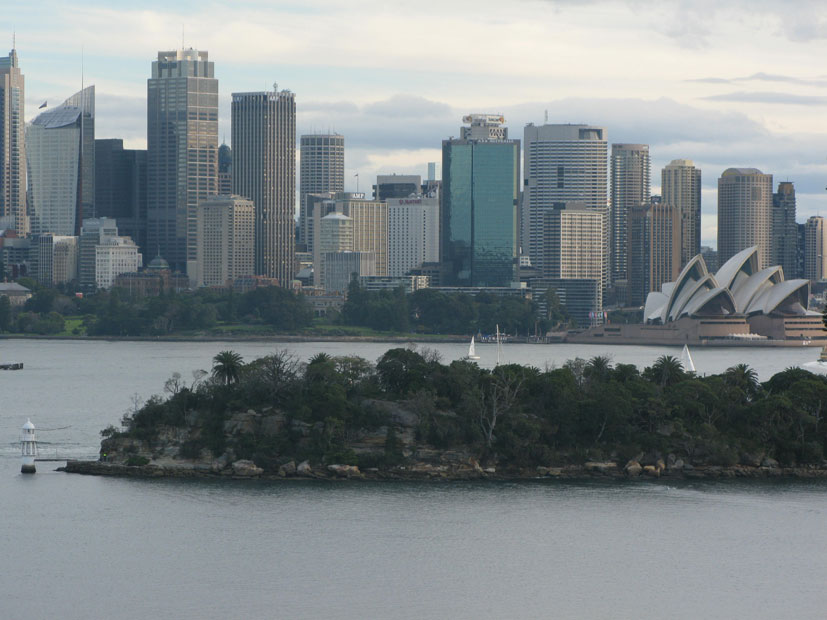 Sydney, Australia
Sydney Opera House (just across the harbor from The Rocks), hardly just that, offered an intriguing tour and unparalleled vistas. The Opera House has several large stages and often runs multiple performances simultaneously. It is an architectural wonder, originally budgeted to cost ~$7 million but eventually completed for about $120 million. From the harbor area we ferried to Manly Beach (named after you know what); to the zoo; and to Darling Harbor, also replete with an Aquarium, scores of restaurants and entertainment for tourists.
We could not find trash in the streets of Sydney. Nor could we find the homeless. But we did notice a favorable disposition on the faces of most people we saw…perhaps because our dollar was in the tank! The “suburban” beaches and beach towns of Sydney were stunning. Our son resides in the Coogee area and, poor guy, lives a block from Coogee Beach. We took a 90 minute walk—the “beach walk”—from Coogee to Bondi Beach, through a few other small beach towns. Surfers everywhere. Beautiful real estate. Imagine walking along a waterfront trail from Sausalito to Mill Valley to Tiburon to Belvedere, all along the water. There you have it.
 Dan Mihalovich feeding the local wildlife
We also ventured on a guided tour from Sydney to the Blue Mountains, their version of the Grand Canyon. Don’t miss this trip! The 2-hour drive each way was filled with a comedic lecture by our driver—the owner of the service, also a volunteer firefighter. Catch the Blue Mountains while you can; residential development is on its way up the mountain and it probably won’t be as pristine for long. There are plenty of great places to stop along the way, including petting zoos where you can get your fill (the Aussies have, for sure) of kangaroos, koalas, wombats, dingos and wallabies.
Heading north (think the distance of San Francisco to LA), the Gold Coast is not only home to a lot of Aussies, but also a large Kiwi population. The area from Byron’s Bay, north, was gorgeous as well. The surf was small, but we paid homage to a couple of the pro-surfer tour stops (Kirra and Coolongatta) just the same. Brisbane, also on the waterfront, is beautiful and easy to navigate with its ferries and pedestrian bridges around its many islands. The city is much smaller and less dynamic than Sydney, but the nearby beach-life and mountains to the west offer plenty of action. By the way, when they say “outback”, trust your instincts. It’s way out there, mate.
One other tip for Surfer’s Paradise. Catch Dracula’s Cabaret show. I’ll leave it at that.
We could only touch a bit of Australia in a two-week period. We’ll have to return one day and ride a few waves at Manly. “No worries”, they say. And “good on ya!”
Tenants: Please Take this “Stress Test”
In these troubled times, we’re trying to help you. We can help by posing the right questions to you and your firm. Stimulate thinking and planning. Problem solving. If you didn’t take our test last quarter, please take it now and call us for help.
Borrowing conceptually from the politicized version in the banking community, our version isn’t sugar-coated and there are no magic accounting spins to color the possible results. The livelihood of your business may depend on your passing grade. See how you fare now.
“The Recession is Over”
So say some of the Wall Street pundits and who can ignore the dramatic improvement in the stock market? Everyone is looking for a shred of good news. Considering the still almighty and powerful lobby that is Wall Street, it is understandable that Washington has bowed to tweak accounting rules and continues to pump billions into publicly traded companies.
Let’s not debate whether the stock market accurately reflects the economy on the ground. The fundamentals remain incredibly weak. More to the point, tenants, the turmoil has brought the landlord community to their knees. The “silver lining”, tenants, is that rental rates and terms are better for you now than when I started representing tenants 27 years ago!
Stay focused on that silver lining, in spite of the fact that our respective stock portfolios remain in the red. If Wall Street’s best want to call the Great Recession over, so be it. But consider the Bear Truth, below, as you plot strategy and financing of your firm’s future.
The Bear Truth
Everyone wants the “recovery”, but will we get a recovery after the recession ends? Everyone wants a great job, even if the Fed reports that you stopped looking. But whether you believe or not in the metrics used to define “recession”, the facts argue that tenants will “enjoy” an extremely lopsided tenants’ market for at least several years to come:
- The office markets dramatically eroded this past quarter, with heavily negative absorption in every Bay Area county, totaling nearly 2.7 million square feet in the red. Negative absorption in San Francisco was nearly 800,000 square feet; the City now has 19.6 million square feet on the market (up 6% from Q1). What more could you want, tenants? Keep in mind that the market isn’t dead; over 1.2 million square feet of leases were signed in Q2 in San Francisco…yet the net effect was negative growth.
- While it’s folly to predict net growth when the markets are performing in such a negative fashion, one could argue that San Francisco now offers a 20-year supply of available space. Does that give you the picture, tenants?
- Whose problem is the vacancy? Landords with direct space or tenants with sublease space to offer? Unlike the office market crash of the Dot-Bomb, when the ratio of direct to sublease space was 2:1…the current market crash puts landlords clearly at the forefront with a ratio of 10:1. Everyone with space on the market is feeling the pain, but the brunt of the damage is hitting the building owner.
- Asking rates are falling precipitously in San Francisco and San Mateo counties, which hold nearly 160 million square feet of the Bay Area’s total 362 million square foot inventory.
- Three years ago I wrote a very bearish opinion piece, partially predicated on the hyped-up, irrational institutional stampede to buy highrise and similar properties around the country. Now, according to Deutsche Bank (parent of RREEF, one of the largest REITs in the nation) commercial real estate prices have dropped 25-30% from their heights in 2007 and will likely decline another 15-20% due to financing market changes. They also argue that as a result there are “perhaps more than a trillion dollars of commercial mortgages scheduled to mature over the next decade that are unlikely to qualify for refinancing without substantial equity infusions from the borrowers.”
Deutsche Bank research continued: “In reality, a large percentage of these loans are likely to default prior to maturity. Thus, a significant part of what we calculate as maturity default-related losses will actually end up as term default losses.” - Locally, Hines, Glenborough (of Morgan Stanley), Lincoln Property Company, Broadway Partners, and Swig Equities have handed back the keys to their properties over to their lenders…and walked away from their office buildings. Tenants, this bodes well for you—as the market will efficiently correct itself and replace the basis of ownership into the hands of landlords properly rooted in realistic underwriting and current market leasing rates. Nearly half of San Francisco’s highrise buildings changed hands during the past 3-5 years, some more than twice. Foreclosures and deed-in-lieu-of-foreclosures will proliferate in the City and around the world, wherever non-sensible acquisition deals were struck. These are very, very sizable setbacks for some of the largest players in the history of commercial real estate. Expect failures at the corporate level, as the markets correct themselves.
Deutsche Bank research doesn’t just direct its concern to the landlord community. Of the $3.4 trillion commercial real estate market, they suggest that banks and life insurance companies make up 50% and 10% of the market, respectively. - National unemployment, which soared from 6% last August to ~10% this June (closer to 15% in our book), represents a 67% increase in unemployment. The trending down of rates to levels of monthly losses of 250,000 jobs is not a harbinger of good news! A “healthy economy”, recall from our presidential elections, requires job growth of around 250,000 jobs per month.
- We’re not alone. The European Union has forecast 11.5% unemployment for 2010.
- We’ve had 10 years of no new private sector jobs.
- Interest rates are at record lows, but the credit vacuum persists if you actually need financing. This creates the perfect storm for the nation’s 45 million homeowners—the fuel we need to drive this consumer-centric economy. The Mortgage Bankers Association said that the foreclosure rate on fixed rate mortgages doubled in the last year. About 12% of all mortgages are either in foreclosure or delinquent.
- Toxic assets remain a herculean problem. Bank of America says that it needs another $34 billion to withstand the economic downturn; this after receiving $45 billion in TARP funds. Morgan Stanley lost $1.3 billion during Q2, its third straight loss. European banks like RBC and UBS, also recipients of bailout funding, continue to choke on bad assets.
- What tenant-sectors will save the economy in the San Francisco Bay Area? One of our stalwart tenant groups in the City, law firms, are in obvious turmoil. Consolidation will likely continue for another year, if not longer, as the entire fee-paradigm has changed and firms scramble for rainmakers. Pfizer’s withdrawal from a Mission Bay project is only one indicator of the biotech recession. Perhaps a bright light will appear from the VC and private equity community. There’s nothing like the motivation of investors who’ve missed the last 25% run-up in the stock market to get them chasing after new opportunities.
Perspective is Paramount in Negotiations
Skip to the chase: Rental rates are cheaper today than 27 years ago, when I began representing tenants in leasing negotiations…NOT adjusted for inflation. But here’s a more recent measure to give you proper perspective: Most sage landlords and landlord-brokers who lived through the Dot-Bomb period (2001) will uniformly agree that the landscape in and around San Francisco was the darkest of all time. Fortunately for you, tenants, that is not true any longer.
During the past few years, amplified greatly by the ongoing recession, more space has come on the market than EVER before. How much more? Don’t be confused by all the metrics about “vacancy” and “absorption rates” (especially since landlord-centric brokerage firms sugar-coat these numbers). The most important factor, tenants, is the number of alternatives available to you in the marketplace. After all, we create negotiating leverage in renewals and relocations based in large part on the number of options—competition between landlords—for you to choose from.
BOTTOM LINE: A quick look at our table of data shows that tenants needing between 5,000-10,000 square feet have 73% MORE options now than during the Dot-Bomb period. Tenants seeking 10,000-20,000 square feet have 31% MORE options; and those seeking 20,000-40,000 square feet have 49% MORE options than during the Dot-Bomb period.
Vacancy Rates: Are Your Options GROWING?
Landlords, their listing brokers and developers dance to the tune of lower vacancy rates, so tenants should watch carefully to detect how and to what extent your field of options changes. Which size blocks of space are getting leased? Discussing vacancy and absorption rates can be confusing to some. What language makes sense to tenants? Tenants ask, “Tell me about my specific options. How many choices do I have?” Are your options growing, as a result of the recent economic turmoil? Review the chart, below, and let’s discuss.
Here’s an intriguing statistic for you. BET YOU’LL BE BAFFLED: In Q2 of 2001, Bay Area Counties had a supply of 42 million square feet available for lease on the market. Today the Bay Area markets have 55 million square feet on the market. Tenants in San Francisco have a LARGER number of parcels to choose from in today’s market than in Q2 of 2001—the period just before our markets crashed. Today the trend for absorption has turned “down”…and the stats should give you reason to wonder—what kind of Kool-Aid has the landlord community been drinking? [In Q2, 2001, there were only 202 parcels of spaces available in San Francisco in the 5-10,000 sf range; 173 parcels in the 10-20,000 sf range; and only 67 parcels in the 20-40,000 sf range.]
Please note: We provide Bay Area market data and analyses for the current year only. To request commercial real estate market data for previous quarters, please contact us.
You can request a free space survey, containing all direct and sublease space meeting your specific requirements. We can also provide building photographs, floor plans, leasing histories and more. You’ll receive your survey within one business day. To discuss your space needs in person, call 415-434-2820 or email dan@TheSpacePlace.net.
Take Me Straight to the Numbers: San Francisco Bay Area Rental Rates. Supply / Demand.
Please note: We provide Bay Area market data and analyses for the current year only. To request commercial real estate market data for previous quarters, please contact us.
Who Has the Most Space in San Francisco? Surprise…
When we approach a prospective new tenant client, we tell them that we NEVER represent landlords, always avoiding this conflict of interest. So, which of our competitors—leasing firms—do the most landlord representation, and who controls the most space in San Francisco? And, most importantly, why would you feel comfortable having them represent YOU?
Below we’ve surveyed the entire 110 million square foot inventory of San Francisco, and illustrated the companies with the most control of space on the market, the Top 25. You know from our other stats that 15.68 million square feet is now on the market in San Francisco. Of the top 7 companies, ALL are office leasing brokerage firms, controlling 58% of the City’s vacancy! These brokerage firms are beholden to more than 300 local landlords. Since their allegiance is committed to so many landlords, how can they possibly represent YOUR interests—the tenant’s interests—objectively and aggressively? The top brokerage companies on the list control more of the City’s vacancy than Tishman Speyer (#9); Shorenstein (#12); RREEF (#11); Hines (#10); and more than Boston Properties (#13). Surprised, are you not? In the case of Studley, our friendly tenant-representation competitor, they represent over 110,000 square feet of space available in 11 different buildings. How can they objectively represent YOU, the tenant, if you choose to pursue any of their sublease space?!
| % Market Share | Square Feet | # of Landlords/ Buildings | ||
|---|---|---|---|---|
The % in the chart below refers to the percentage of vacant space under exclusive listing by each company. The accompanying figure is the actual square footage available for lease. We have also noted the number of landlords / buildings represented by each entity. * Denotes listing brokers. All other companies listed are landlordselopers. |
||||
| 1 | *The CAC Group | 13.2% | 3,163,861 | 62 |
| 2 | *Jones Lang LaSalle | 12.1% | 2,909,231 | 28 |
| 3 | *CB Richard Ellis | 7.3% | 1,744,823 | 29 |
| 4 | *Cornish & Carey Commercial - ONCOR | 7.2% | 1,718,158 | 25 |
| 5 | *Cushman & Wakefield of California | 7.1% | 1,696,429 | 64 |
| 6 | *Colliers International | 6.7% | 1,613,566 | 77 |
| 7 | *Grubb & Ellis | 5.7% | 1,367,022 | 50 |
| 8 | *GVA Kidder Mathews | 4.9% | 1,181,997 | 33 |
| 9 | *Newmark Knight Frank | 1.8% | 425,908 | 13 |
| 10 | Tishman Speyer | 1.7% | 412,190 | 3 |
| 11 | RREEF America LLC | 1.7% | 400,000 | 1 |
| 12 | Hines | 1.5% | 359,347 | 9 |
| 13 | Beacon Capital Partners, Inc. | 1.3% | 307,000 | 1 |
| 14 | Boston Properties | 1.1% | 273,262 | 4 |
| 15 | SKS Investments | 1.0% | 250,000 | 2 |
| 16 | McCarthy Cook & Co. | 1.0% | 244,342 | 3 |
| 17 | Retail West | 1.0% | 242,000 | 1 |
| 18 | *TRI Commercial / CORFAC Intl | 0.9% | 222,038 | 43 |
| 19 | *NAI BT Commercial | 0.9% | 209,215 | 22 |
| 20 | The Presidio Trust | 0.8% | 203,144 | 38 |
| 21 | *Colton Commercial & Partners | 0.7% | 157,183 | 20 |
| 22 | JRT Realty Group, Inc. | 0.6% | 143,086 | 1 |
| 23 | Shorenstein Company, LLC | 0.6% | 138,362 | 7 |
| 24 | *Sansome Street Advisors | 0.6% | 134,981 | 7 |
| 25 | *Johnson Hoke Ltd | 0.5% | 131,215 | 5 |
| Total | 23,963,374 | |||