


REAL ESTATE NEWS & EDITORIAL
FOURTH QUARTER 2016
From Dan Mihalovich, Principal of Mihalovich Partners and Founder of The Space Place
If you're in search of intelligent life in the brokerage community... please enjoy this Editorial with my compliments.
In this Issue:
- Welcome to the New Normal
- 2017 Office Markets: Pace Will Continue. Yeah, Not.
- Tenant Demand in Casino Camelot... aka San Francisco
- Our Clients Love Using griddig – CRE’s First Live Marketplace for Office Leasing Deal-Making
- 4Q 2016 Top Leasing Transactions
- If Your Lease Will Expire Within The Next Three Years...
- Vacancy Rates: Are Your Options Fading?
- Five Brokerage Firms / 9M SqFt of Space / 430 Buildings Listed: How Do You Spell "Conflict of Interest"?
The last 10 years of our pearls of wisdom:
- Editorial Archives
- Our 40 letters of recommendation
- Our Case Studies (Calif Academy of Sciences; Bar Assn of San Fran; WSGR)
- What Makes Us Different? Tenant Services.
MIHALOVICH PARTNERS
505 Montgomery Street, Suite 1100
San Francisco, CA 94111
License # 01376000
Office: 415-434-2820
Cell: 415-999-9244
Email: dan@TheSpacePlace.net
Web: www.TheSpacePlace.net
Twitter: @MihalovichCRE
Thank You to Our Clients & Friends
We believe that representing tenants – and only tenants – is a noble cause, our specialty for over thirty years. We greatly appreciate our clients’ confidence and kind words about us, our level of advocacy and enthusiasm to negotiate aggressively... and mind the details while guiding the leasing process. Here’s to a spectacularly successful 2017.


Welcome to the New Normal
Welcome, ’17, to the new normal. Having returned from a visit to Wash. D.C., we can confirm that indeed we have a new President. The rest is TBD, folks. Try as we must to focus on our Bay Area backyard, those of you transfixed by office market stats will enjoy the points below. Notwithstanding the active controversies between the White House, Saturday Night Live, the 9th Circuit, NAACP, CIA, FBI, ISIS, NSA, WIKI...holy expansion, let’s talk about the Bay Area office market!
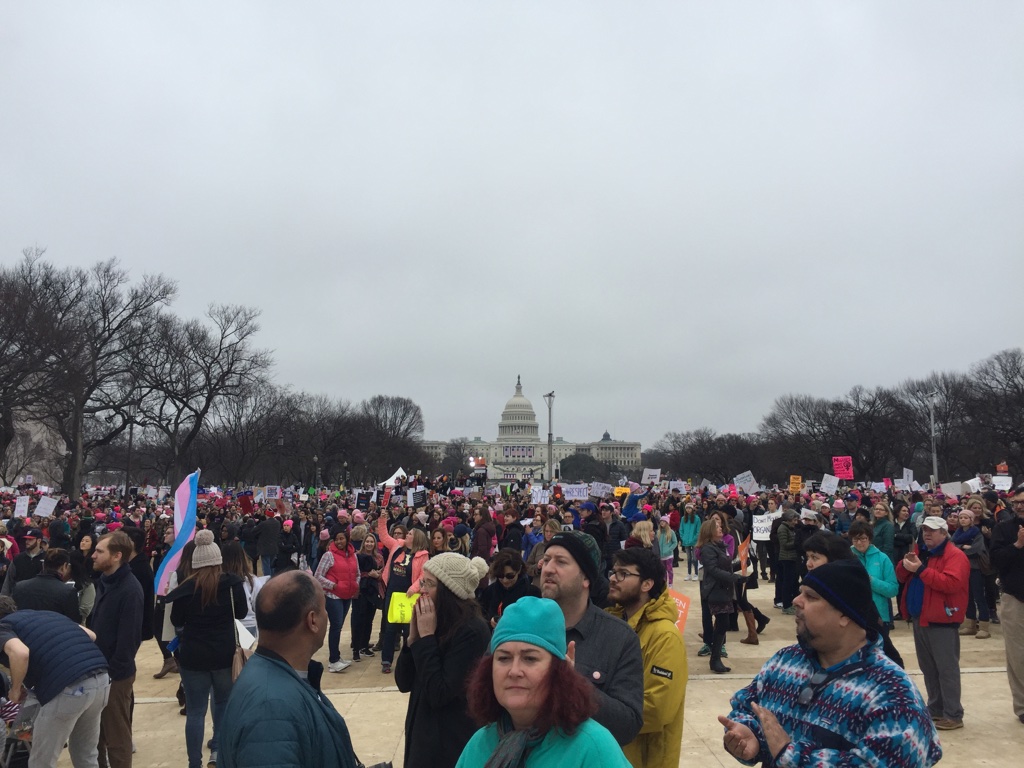
Inauguration Day:
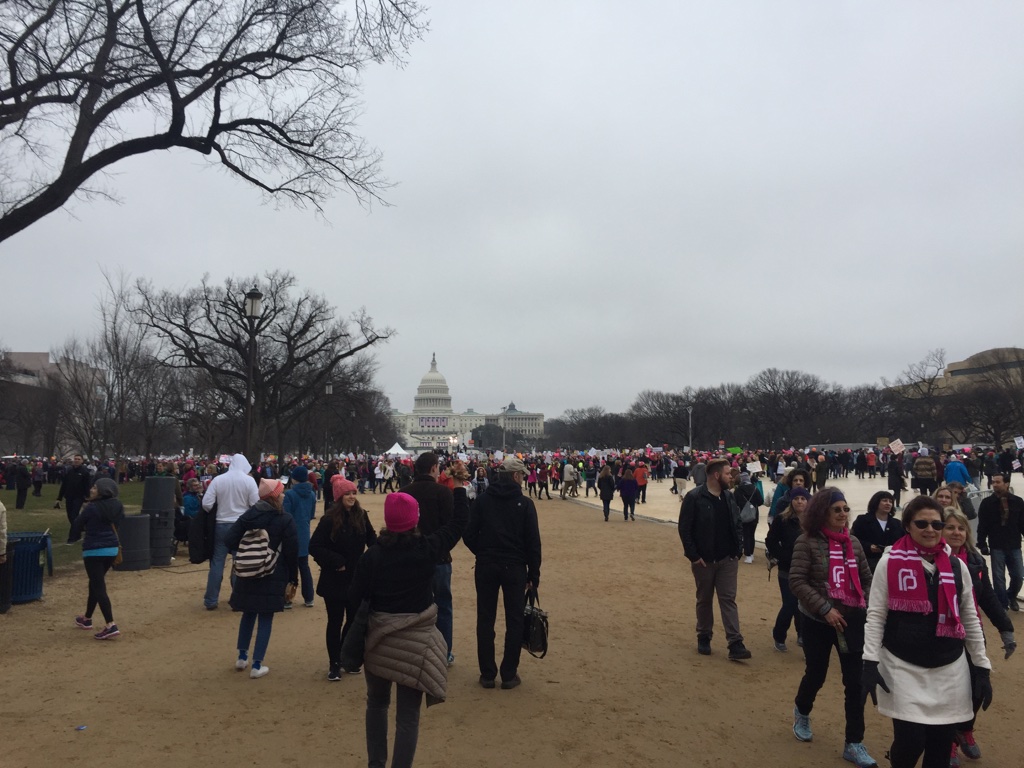
Women's March Day:

2017 Office Markets: Pace Will Continue. Yeah, Not.
Pore over the stats as you wish, but notice that the markets are WORKING: Tenants are voting with their feet. Absorption of space is highest in the least expensive markets (East Bay), and lowest – negative growth, in fact, for direct space in San Francisco. Office leasing rental rates in San Francisco are stifling hot, but starting to loosen up. Patience, intelligent planning and negotiating do pay dividends. But there remains no shortage of over-capitalized tenants willing to pay the sun/moon/stars for the right space. These tenants feed landlord’s expectations, of course....and make it more difficult for traditional tenants to find “affordable” options. We are experts – and solely focused – on representing tenants in leasing negotiations and project management....whether in tight markets or otherwise.
After reading through this Market Editorial, please see our collection of educational articles we’ve written to our tenant community.
San Francisco, aka Camelot
- 13.3 M square feet available (direct + sublease)
- 1.9M sf is sublease (14% of total)
- 11% total inventory is available
- 4.1M sf under construction (will add 4% to total inventory)
- Market size 116M sf
- Total Net Absorption, Q4: 58,000 sf. Direct space: <73,000> sf.
San Mateo County
- 5.4 M square feet available (direct + sublease)
- 1.2M sf is sublease (22% of total)
- 11% total available
- .8M sf under construction (will add 2% to total inventory)
- Market size 51M sf
- Total Net Absorption, Q4: 95,000 sf. Direct space: 112,000 sf.
Alameda/Contra Costa Counties:
- 12 M square feet available (direct + sublease)
- 1.3M sf is sublease (11% of total)
- 11% total available
- .7M sf under construction (will add <1% to total inventory)
- Market size 111M sf
- Total Net Absorption, Q4: 440,000 sf. Direct space: 400,000 sf.
Tenant Demand: Steady (Well, Sort Of....)
Dear Office-Tenant Community: Technology companies -- clearly the driving demand factor in office markets around the country -- get their lifeblood from venture capital. So, where are we in the VC cycle NOW? If the flow of VC slows, crawls or evaporates, will the office markets collapse --- and if such a scenario is likely in the foreseeable future, when might this occur? We asked for an update (from last quarter) from a local brainbox – a venture capitalist whose tenured company has more than $1B invested in public and private tech. We agreed not to disclose the VC’s name, but here’s a direct quote:
"No bold calls here, at least not yet, but I think there are some interesting cross currents underlying this market....."
The fourth quarter into the beginning of 2017 has been a wild ride in the public equity markets. In September and October we were in what felt like a late business cycle, fed-driven market. Following the election, the market changed dramatically, with significant outperformance experienced in small-mid cap stocks and cyclical sectors, representing optimism around potentially more accommodating fiscal policy and deregulation.
While I place a high likelihood on the probability of a lower corporate tax rate in the future, I think equity market moves are pricing in more than tax just reform. I find material and sustained long term GDP growth acceleration somewhat unlikely given demographic headwinds and the fed's indication that they will keep growth below the recovery average.
Moreover, we are 7.5 years into an expansion, there is not much remaining slack in the labor market, corporate margins feel peaky, and prior to the election consumer credit, autos and other indicators were showing signs that the business cycle was long in the tooth. Additionally, the global wave of populism evidenced by Brexit and the US election will likely continue across Europe in 2017 elections. Implementation of increasingly protectionist policies could weigh on global GDP growth.
That being said, I do not think the cycle is rolling over in the short term, just that equity market reactions have been somewhat overly optimistic given the length of the current cycle. I do believe that more accommodating fiscal policy could extend the cycle SLIGHTLY due to benefits from tax cuts, stimulus spending, and boosted consumer and business confidence.
This would all seem to indicate a steady leasing environment, with some puts and takes and perhaps a wider range of potential outcomes. More specific to the Bay Area, venture capital funding remains challenged when compared to the strength of 2015 and 2014, but still quite healthy relative to historical average absolute levels.
4Q US venture funding declined 25% y/y but remained robust in absolute terms at $12.71B (Source: Pitchbook/ NVCA). This softness was seen across funding stages: Angel funding $ deal volume was -14% y/y, early-stage was -20% y/y, and late stage was -30% y/y in 4Q (Source: Pitchbook/ NVCA).
However, this does not mean that VCs do not have cash. VC funds raised $42B in 2016, the highest total of the past decade (Source: Pitchbook/ NVCA). As such, VCs should be able to continue to fund the ecosystem at robust levels in both new companies and follow on investments.
The IPO environment was very weak in 2016, with VC-funded company IPO exits -64% y/y in dollar volume. However, 2017 looks to be a better year, with major deals on the horizon including Snapchat, Airbnb, Uber, Palantir, HotelTonight, Spotify, Cloudera, and Dropbox, amongst others.
These VC ecosystem demand indicators all point to softening, but still healthy demand for office space from the VC-funded environment, with potential upside driven by a resurgence of IPO activity in 2017.
In summary, the broad macro picture is mixed, with optimism around growth-minded fiscal policy at least partially offset by fears around the extended business cycle as well as the global rising tide of populism and protectionist policy. The VC ecosystem has slowed from cyclical highs but remains healthy. As such, the demand side of the equation likely remains consistent with current trends, but I would advise mindfulness around the fact that we are nearly 8 years into an expansion, which will inevitably turn at some point regardless of fiscal policy."
Our job at Mihalovich Partners is to advocate for our clients -- tenants -- in office leasing negotiations. Analyzing and understanding market dynamics makes us more valuable than our competitors at the negotiating table. Think about our representing your interests in your next office leasing negotiation.
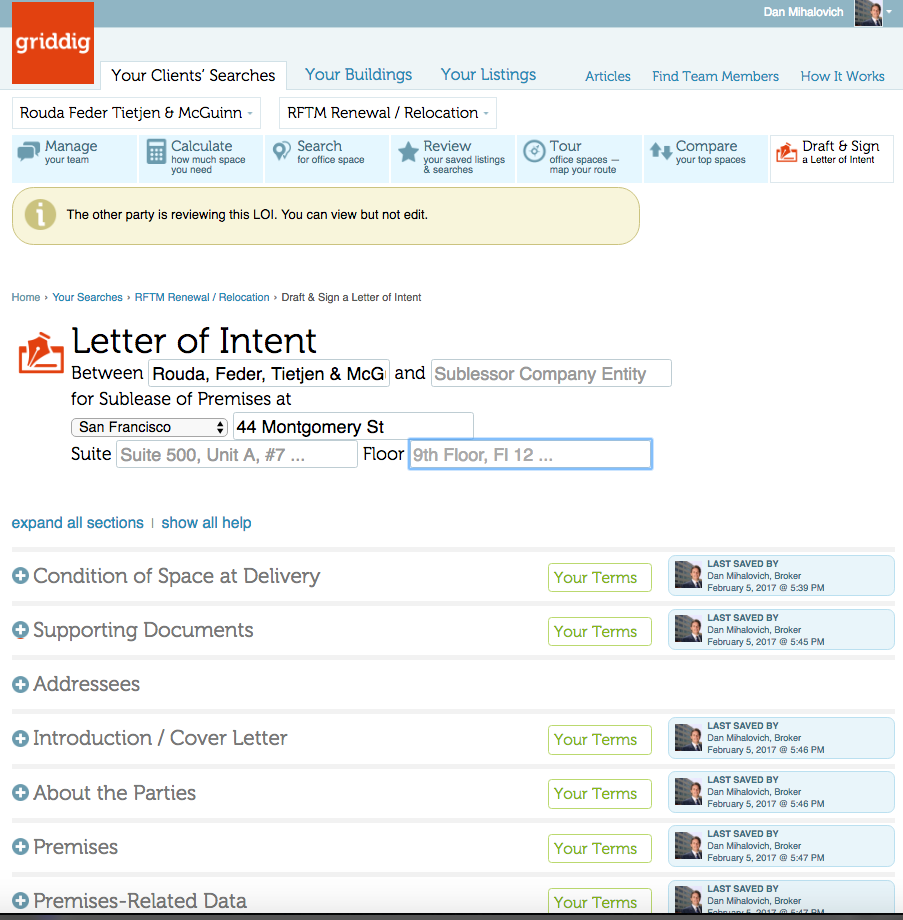
While you're contemplating, check out our industry's first live marketplace for office leasing deal-making: griddig. Public listings, free search. Negotiate and fully execute Letters of Intent on the platform without making mistakes. It's online transparent collaboration, team-driven.
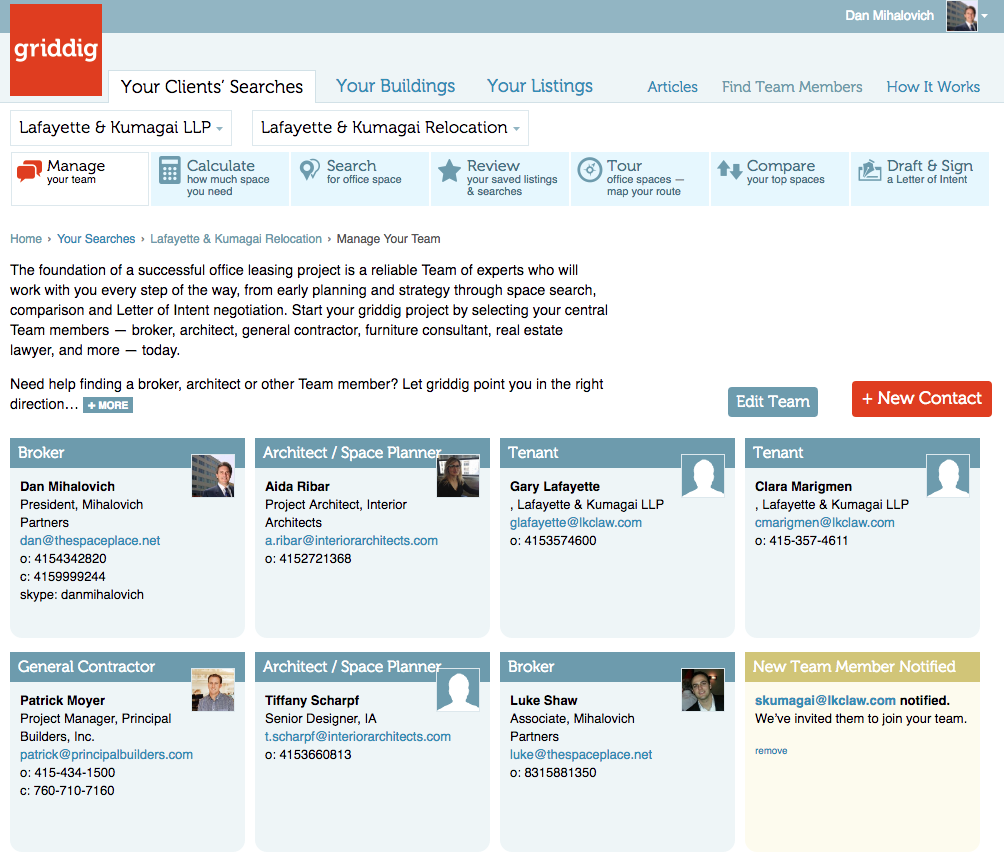
Our Clients Love Using griddig – CRE’s First Live Marketplace for Office Leasing Deal-Making
It's the fastest, most collaborative, fool-proof way to speed through deal-making and get it right the first time. No surprises. No mistakes. The shortest distance to decisions and closed deals.
Try it FREE. griddig improves the entire industry's performance -- join Landlords, Tenants, Brokers and Service Providers in the LIVE MARKETPLACE and start your next deal today. Sneak peek below...
4Q 2016 Top Leasing Transactions
| SAN FRANCISCO | ||
| Tenant | Address | Sq Ft |
|---|---|---|
| Nerd Wallet | 1-10th Street | 105,000 |
| Thumbtack | 1355 Market | 79,000 |
| Adroll | 2300 Harrison | 64,000 |
| BlendLabs | 500 Pine | 57,000 |
| - | 71 Stevenson | 53,000 |
| SAN MATEO COUNTY | ||
| Tenant | Address | Sq Ft |
| Merck | 213 E. Grand, SSF | 290,000 |
| OpenText | 2950 S. Delaware/Bay Meadows | 108,000 |
| Qualys | 919 E. Hillsdale/Metro Center | 75,000 |
| - | 225 California, Burlingame | 56,000 |
| Nevro | 1600 Bridge Pkwy, Foster City | 50,000 |
| EAST BAY COUNTIES (Alameda/Contra Costa) | ||
| Tenant | Address | Sq Ft |
| GE Digital | 2600 Camino Ramon, Bishop Ranch | 100,000 |
| Bay Health | 3100 San Pablo, Foundry 31 | 65,000 |
| TriNet Group | 1100 S. San Leandro | 49,000 |
| - | 8000 Edgewater, Oakland Airport Park | 32,000 |
| - | 5980 Horton, Emory Station North | 26,000 |
If Your Lease Will Expire Within The Next Three Years...
or if there is another compelling reason to discuss your firm's office leasing situation, please call us. For qualified tenants, we offer the following pre-contract services:
- Free preliminary office lease and operating expense review;
- Free consultation to discuss project management, Team formation and project schedule;
- Market surveys and our specific tenant-driven leasing recommendations ; and
- Assistance in selection and coordination of all Team members throughout planning and negotiation phases.
Vacancy Rates: Are Your Options Fading?
Tenants should watch carefully to detect how and to what extent your field of options changes. Which size blocks of space are getting leased? Discussing vacancy and absorption rates can be confusing to some. What language makes sense to tenants? Tenants ask, "Tell me about my specific options. How many choices do I have?" Are your options fading, as a result of leasing activity? Review the chart, below, and let's discuss.
| HOW MANY BLOCKS OF SPACE ARE AVAILABLE FOR YOU? | San Francisco County | San Mateo County | East Bay Counties | ||||
|---|---|---|---|---|---|---|---|
| Q3’16 | Q4’16 | ||||||
| 5,000–9,999 sq. ft. | 274 | 281 | Call us for more info | ||||
| ▲ 3% | |||||||
| 10,000–19,999 | 152 | 155 | |||||
| ▲ 2% | |||||||
| 20,000–29,999 | 51 | 46 | |||||
| ▼ 11% | |||||||
| 30,000–39,999 | 27 | 28 | |||||
| ▲ 4% | |||||||
| 40,000–49,999 | 13 | 10 | |||||
| ▼ 30% | |||||||
| 50,000+ | 43 | 38 | |||||
| ▼ 13% | |||||||
You can request a free space survey, containing all direct and sublease space meeting your specific requirements. We can also provide building photographs, floor plans, leasing histories and more. To discuss your space needs in person, call 415-999-9244 or email dan@TheSpacePlace.net.
Five Brokerage Firms / 9M SqFt of Space / 430 Buildings Listed: How Do You Spell “Conflict of Interest”?
When we approach a prospective new tenant client, we tell them that we NEVER represent landlords, always avoiding this conflict of interest. So, which of our competitors—leasing firms—do the most landlord representation? Who’s marketing 75% of the space in San Francisco?
The top companies controlling the most space available are NOT landlords... Rather, they are office leasing brokerage firms acting with the landlord’s interest in mind. They are:
CBRE
JLL
Cushman & Wakefield
Colliers
Newmark, Cornish & Carey
These brokerage firms control over 75% of all listings and are beholden to more than 430 local landlords, paid to drive up rental rates and drive down concessions for tenants.
Since their allegiance is committed to so many landlords, how can they possibly represent YOUR interests—the tenant’s interests—objectively and aggressively?