


REAL ESTATE NEWS & EDITORIAL
THIRD QUARTER 2016
From Dan Mihalovich, Principal of Mihalovich Partners and Founder of The Space Place
If you're in search of intelligent life in the brokerage community... please enjoy this Editorial with my compliments.
In this Issue:
- Thank You to Our Clients & Friends
- Voting with Your Feet: My Landlord Blows.
- Every Building is For Sale. #SFOfficeSpace.
- Follow the (Tech) Money <> Cost of Office Space in San Francisco
- Our Clients Love Using griddig – CRE’s First Live Marketplace for Office Leasing Deal-Making
- 3Q 2016 Top Leasing Transactions
- If Your Lease Will Expire Within The Next Three Years...
- Vacancy Rates: Are Your Options Fading?
- Five Brokerage Firms / 11M SqFt of Space / 457 Buildings Listed: How Do You Spell "Conflict of Interest"?
The last 10 years of our pearls of wisdom:
- Editorial Archives
- Our 40 letters of recommendation
- Our Case Studies (Calif Academy of Sciences; Bar Assn of San Fran; WSGR)
- What Makes Us Different? Tenant Services.
MIHALOVICH PARTNERS
655 Montgomery Street, Suite 1200
San Francisco, CA 94111
License # 01376000
Office: 415-434-2820
Cell: 415-999-9244
Email: dan@TheSpacePlace.net
Web: www.TheSpacePlace.net
Twitter: @MihalovichCRE
Skype: danmihalovich
Thank You to Our Clients & Friends
We believe that representing tenants – and only tenants – is a noble cause, our specialty for over thirty years. We greatly appreciate our clients’ confidence and kind words about us, our level of advocacy and enthusiasm to negotiate aggressively ….. and mind the details while guiding the leasing process. Here’s to a spectacularly successful 2016.


Voting with Your Feet: My Landlord Blows.
Life’s certainties: death, taxes and….yes….your landlord will treat you like a captive tenant. You’ve built infrastructure into your space. Your employees have grown accustomed to the place and the commute. Internet speed screams. The neighboring restaurants are familiar and the overhead costs have been sustainable. And then it’s renewal time.
And your rent is doubling?!
This has been the phenom during the past couple of years around here. Although the landscape is changing. The point – often made in these editorials – is to be prepared, leveraged and ready to vote with your feet. If the buck stops on your desk, you simply must have gone beyond due diligence to create real…..makeable….sensible alternative deals to renewal -- elsewhere. There is no substitute.
You may have noticed that your landlord has remeasured your space – under the guise of 2010 BOMA space measurement standards, which essentially empowers owners to “find” more square footage in their buildings. Our write-up on this radioactive issue has been published in statewide legal rags … and most recently in the Registry, a Bay Area CRE publication. The remeasurement will either kick in upon your renewal or upon sale of the building….and there’s not much you can do about it. In a few cases recently, the owners of a few buildings housing our clients have found 8-9% more space through this method. That’s an 8-9% rent increase before considering higher asking rates.
Every Building is For Sale. # SF Office Space Trending.
Uncontrolled speculation brought us here.
Vacancy in your building up? Pushing your oldest tenants out the door? Demolishing tenant improvements before that desired tech prospect actually shows up? Hey – it’s the perfect time to sell your building!
The sale makes it all worthwhile. What landlord needs to bother taking risk in the leasing market, when as an owner one can simply let space lie fallow for months or even a year or two; blow out your perfectly performing stalwart tenants to be replaced by tech tenants who’ll pay any ridiculous price as replacement (as long as techies can cram in one person per 100 square feet); and wait for the Chinese to buy the building at a 2% cap rate.
Let’s not sugar-coat how much speculative capital is flowing down Main Street. Effectively free money is everywhere, floating all assets – not only CRE assets, but also assets called “tech companies”. It’s not just the supply of VC capital infusing growth and speculation into the marketplace [see “Follow the (Tech) Money”]; it’s the flight of foreign capital seeking refuge and “stability” in U.S. office markets. But we’ve seen this drama before: The growing chasm between hyper-inflated office building prices….and the affordability of office space to sustainable tenants.
Is the music changing, or not? Certainly the landlord community and their brokers (JLL, CBRE, C&W, Colliers and Newmark) talk their position: The sky is the limit and – tenants – you’re expected to pay the piper and like it. But the market stats and other facts say otherwise:
- In San Francisco (a 116M sf marketplace), the net absorption of office space has DECLINED for three consecutive quarters. In fact, 3Q net absorption was NEGATIVE….less than zero….since more space came on the market than was leased, by 160,000 square feet.
- 3Q’s total leasing activity and the number of deals in San Francisco was the LOWEST IN 7 YEARS.
- The City’s total amount of space on the market has increased 5 QUARTERS IN A ROW, to 14.3 million square feet – around 12%.
- The landscape is changing in similar fashion in the East Bay (Contra Costa and Alameda Counties, a 110M sf marketplace), where availabilities have increased three quarters in a row to ~12 million square feet. Net absorption of space declined to NEGATIVE 37,000 square feet. And leasing activity and the number of transactions was at its lowest in four years.
- 3Q in San Mateo County (a 50M sf marketplace) saw a 6-year low in direct leasing activity and an 8-year low in the number of leasing transactions.
- If the market is so tight and landlords are so bullish, why are there so few long-term-hold owners? The name of the game is to be quick to “add value” – a lobby renovation, common area upgrades, take 18 to 24 months to lease the majority of vacant space; and then flip the sale before the market turns. But also notice other signs of market weakening:
- Broker incentives are on the rise. Broker Open House parties with give-away prizes. Broker bonus commission incentives. Why not just lower the asking rental rates?
- Large blocks of space, including the 4M square feet under development, are being heavily marketed NOW, far in advance of the buildings’ completion. In fear of a declining market, landlords are trying to lock in these stratospheric rental rates. (Large tenants in fear of a lack of contiguous space in the future are taking the bait.)
- Traditional non-VC-backed tenants have been suffering trying to remain profitable staring at $60-$90/sf/year rates, mostly downsizing and/or vacating San Francisco for the suburbs. How else can we explain Oakland rates in the $50s?! Sublease activity levels, relative to direct space, are up – as tenants (and many of our clients) “dodge the bullet” with shorter term commitments at discounts to direct space.
Follow the (Tech) Money >< Cost of Office Space in San Francisco
To our Office-Tenant Community: TECH, clearly the driving demand factor in office markets around the country, gets its lifeblood from venture capital. So, where are we in the VC cycle NOW? If the flow of VC slows, crawls or evaporates, will the office markets collapse --- and if such a scenario is even likely in the foreseeable future, WHEN might this occur? We asked for an update (from last quarter) from a local brainbox – a venture capitalist whose tenured company has more than $1B invested in public and private tech. We agreed not to disclose the VC’s name, but here’s a direct quote:
"Not much changing with my macro and tech ecosystem view since our last update. I continue to believe that the current cycle is long in the tooth and that asset prices will remain range bound, with moves dominated by fed rhetoric and positioning.
Employment indicators have moderated in September. Unemployment is running at 5%, up 30bps from the May 2016 trough of 4.7%. NGDP growth is running at 2.5% y/y—the low end of the recovery range. Wages on the other hand, are growing at the high end of the recovery range. This is a negative sign for corporate earnings into the 3Q reporting season.
Fed commentary, though, has been hawkish. Fed fund futures are currently pricing in a ~64% probability of a 25bp raise in December. I am unconvinced that the Fed will actually raise given the softening economy, but if they do, equity market risk is to the downside. No raise shifts this bias to the upside. Barring a recession, I do not see big moves in either direction—just trading in the current range.
Other risks to equity markets include a weak GBP/ strong USD, a tumultuous geopolitical environment, and a precariously situated European banking system (see DB).
The VC ecosystem continues to invest at slower levels than 2015, but still in large $ volumes (data from CB Insights). Global VC funding was -14% Q/Q and -39% y/y in 3Q’16. $ volumes are still massive, though, at $24.1B and still up slightly from 2014 levels. Similarly, North American VC funding was -18% Q/Q and -29% Y/Y, but remained slightly above 3Q’15 levels with large $ volumes ($14.4B). VC firms raised $9B in 3Q and $32.4B YTD (per Bloomberg). This compares to $36B raised in all of 2015. As such, VC firms appear well capitalized to continue to back the ecosystem. This would all indicate a slower, but still robust impact from VC backed companies on CRE.
The IPO markets have shown a more positive signal. Recent IPOs have traded quite well, with COUP, NTNX, APTI, GSUM, TTD, and EVBG all trading well above their issue levels. It is important to note, though, that these deals were priced quite reasonably. The average IPO has priced at 3x forward revenues, the lowest multiple of any recent IPO cohort. Clearly, these deals would not be trading as well had they been priced more in line with 2014 levels (4.9x forward revenues).
In summary, the technology ecosystem continues to be confused, with a mixed macroeconomic environment and a slower (but still active) VC funding environment, and some signs of life in a newly active but low priced IPO market."
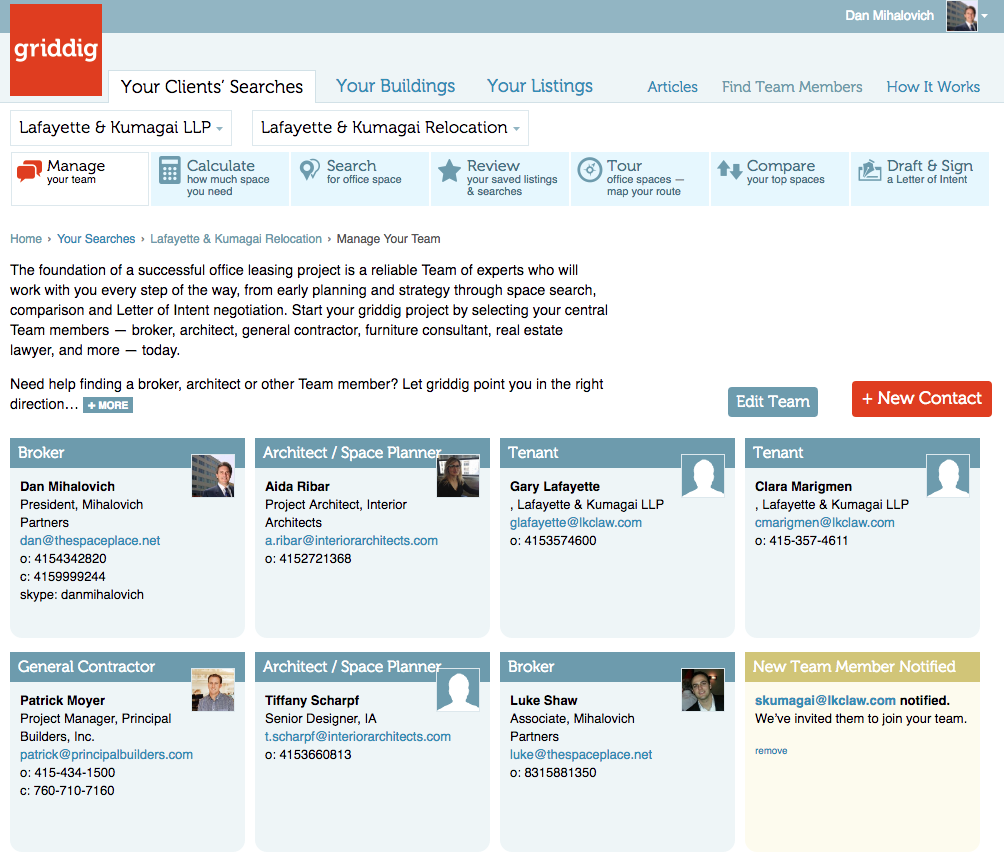
Our Clients Love Using griddig – CRE’s First Live Marketplace for Office Leasing Deal-Making
It's the fastest, most collaborative, fool-proof way to speed through deal-making and get it right the first time. No surprises. No mistakes. The shortest distance to decisions and closed deals.
Try it FREE for 2016. griddig improves the entire industry's
performance -- join Landlords, Tenants, Brokers and Service
Providers in the LIVE MARKETPLACE and start your next deal
today. Sneak peek below...
3Q 2016 Top Leasing Transactions
| SAN FRANCISCO | ||
| Tenant | Address | Sq Ft |
|---|---|---|
| Twitch | 350 Bush | 240,000 |
| We Work | Two Embarcadero Center | 78,000 |
| PWC | Three Embarcadero Center | 77,000 |
| -- | Foundry Sq. III, 505 Howard | 75,000 |
| Open AI | 3180 18th | 37,000 |
| SAN MATEO COUNTY | ||
| Tenant | Address | Sq Ft |
| -- | 162 Jefferson, Menlo Park | 135,000 |
| VW | 500-600 Clipper, Island Park, Belmont | 53,000 |
| Achaogen | 1 Tower Place, SSF | 47,000 |
| -- | 975 Island Dr, Redwood Shores | 25,000 |
| -- | 101 S. San Mateo Dr, San Mateo | 24,000 |
| EAST BAY COUNTIES (Alameda/Contra Costa) | ||
| Tenant | Address | Sq Ft |
| Rodan & Fields | 2600 Camino Ramon, Bishop Ranch | 150,000 |
| Ellie Mae | 4430 Rosewood Dr, Bldg 3, Pleasanton | 144,000 |
| Travelers | 401 Lennon Ln, WC Shadelands | 90,000 |
| Edgewater Consultants | 7700 Edgewater Dr, Oakland | 45,000 |
| -- | 4140 Dublin Blvd, Dublin Corp Center | 34,000 |
If Your Lease Will Expire Within The Next Three Years…
or if there is another compelling reason to discuss your firm's office leasing situation, please call us. For qualified tenants, we offer the following pre-contract services:
- Free preliminary office lease and operating expense review;
- Free consultation to discuss project management, Team formation and project schedule;
- Market surveys and our specific tenant-driven leasing recommendations ; and
- Assistance in selection and coordination of all Team members throughout planning and negotiation phases.
Vacancy Rates: Are Your Options Fading?
Tenants should watch carefully to detect how and to what extent your field of options changes. Which size blocks of space are getting leased? Discussing vacancy and absorption rates can be confusing to some. What language makes sense to tenants? Tenants ask, "Tell me about my specific options. How many choices do I have?" Are your options fading, as a result of leasing activity? Review the chart, below, and let's discuss.
| HOW MANY BLOCKS OF SPACE ARE AVAILABLE FOR YOU? | San Francisco County | San Mateo County | East Bay Counties | ||||
|---|---|---|---|---|---|---|---|
| Q2’16 | Q3’16 | ||||||
| 5,000–9,999 sq. ft. | 303 | 274 | Call us for more info | ||||
| ▼ 11% | |||||||
| 10,000–19,999 | 172 | 152 | |||||
| ▼ 13% | |||||||
| 20,000–29,999 | 54 | 51 | |||||
| ▼ 6% | |||||||
| 30,000–39,999 | 26 | 27 | |||||
| ▲ 4% | |||||||
| 40,000–49,999 | 18 | 13 | |||||
| ▼ 38% | |||||||
| 50,000+ | 48 | 43 | |||||
| ▼ 12% | |||||||
You can request a free space survey, containing all direct and sublease space meeting your specific requirements. We can also provide building photographs, floor plans, leasing histories and more. To discuss your space needs in person, call 415-434-2820 or email dan@TheSpacePlace.net.
Five Brokerage Firms / 11M SqFt of Space / 457 Buildings Listed: How Do You Spell “Conflict of Interest”?
When we approach a prospective new tenant client, we tell them that we NEVER represent landlords, always avoiding this conflict of interest. So, which of our competitors—leasing firms—do the most landlord representation? Who’s marketing 75% of the space in San Francisco?
The top companies controlling the most space available are NOT landlords….Rather, they are office leasing brokerage firms acting with the landlord’s interest in mind. They are:
CBRE
JLL
Cushman & Wakefield
Colliers
Newmark, Cornish & Carey
These brokerage firms control over 75% of all listings and are beholden to more than 450 local landlords, paid to drive up rental rates and drive down concessions for tenants.
Since their allegiance is committed to so many landlords, how can they possibly represent YOUR interests—the tenant’s interests—objectively and aggressively?