


Market Insight Editorial & Advice to Tenants: 1Q2011
In this Issue:
- Buyer Beware: Structurally Impaired Economy
- 59 Million Square Feet On The Market
- New Kool-Aid: San Francisco Bubble, With Recession-Back
- Mr. Landlord: You Want MORE Space? Pay Me To Leave
- Economic Sustainability Test For Tenants
- To Attract Social Media/Tech, All Space Is “Creative” Space
- Vacancy Rates: Are Your Options Fading?
- Robert Reich. Is It All About The Election? What About The Economy?
- Financial Repression. Negative Real Returns. Just Another PIMCO Day.
- Who Has The Most Incentive To Drive Up Rental Rates In San Francisco?
Buyer Beware: Structurally Impaired Economy
Pessimism is the unwelcome and un-American serving of bad attitude, albeit the righteous market call at present. Our markets appear to have absorbed the unimaginable worst financial calamities since the Great Depression, here and abroad; Wall Street’s injustices; the human and gaping costs of fighting wars in Iraq, Afghanistan and Libya; record joblessness; earthquakes, tsunamis, nuclear power meltdowns, twisters, floods; overthrown sovereign governments; consumer fear and complacency; and, of course, the local, state and Federal massive debt acquired to “right” the economy. Can we digest any more bad news? Surely it is coming. Perhaps the optimism in the crowd stems from the notion that nothing worse could ever fall upon us. Maybe Google, Facebook or Twitter will save the day.
In his recent Commencement speech at Cal Berkeley, former Labor Secretary and Professor Robert Reich dished it out pretty straight: The stock market is not us. Unemployment is horrifying. Real wages for most Americans are declining. The housing market remains a disaster. But over the past few decades, wealth has consistently flowed to the top 0.1% of Americans. CEO pay is up 11% over last year. And the economics of politics has evolved such that more and more money has flowed into creating historic gridlock in Washington, preventing significant reform from taking place.
The Fed’s contrived support system, (TARP, QE1 and) QE2, may soon expire and where will we be then? Capitol Hill must vote to go more heavily (than $14 trillion) into debt by July, or the U.S. may begin defaulting on its commitments. That couldn’t happen, could it? And what would wildly bullish landlords and their brokers in San Francisco have to say about that?!
I’ve posted a few pearls, here, from Robert Reich and the folks from PIMCO, who recently conducted their 2011 Secular Forum with our brightest economic brainpower present. Their collective analysis leaves one with a different kind of quaking experience: While Rome is burning, we’d better pay flipping attention and be prepared to pull our respective oars. Maybe you’ll find the “bull” in their presentations; I hear it from the local landlord community. Believe it or not.
If you’re in search of intelligent life in the brokerage community…please enjoy this Editorial with my compliments. And, here are the last 10 years of pearls of wisdom.
Dan Mihalovich
President, Mihalovich Partners
Founder, The Space Place®
59 Million Square Feet On The Market
Q1, 2011 in the San Francisco Bay Area wrapped up as follows:
| square feet available (millions) | average time on market (months) | |
|---|---|---|
| San Francisco | 17.3 | 26.6 |
| San Mateo County | 7.5 | 21.2 |
| Santa Clara County | 17.0 | 26 |
| Contra Costa & Alameda Counties |
17.5 | 22.9 |
There is nothing bullish in these figures. In fact, our markets crashed under the weight of less supply during the Dot Bomb, in Q2 of 2001, when only 42 million square feet were available for lease. Tenants have a larger number of parcels to choose from in today’s market than during the Dot Bomb crash.
New Kool-Aid: San Francisco Bubble, with Recession-Back
With three quarters in a row of positive absorption of space in San Francisco (nowhere else is there such a “trend” in the Bay Area), the activity finds many tenants chasing one another up the same tree: looking for “Creative” Space. The hype in the marketplace should not be ignored, but should be better understood.
We have a serious bubble of activity going on here in San Francisco and some points south. With IPOs in their eyes, many a tech and social media company look to double (or more) their office space needs in the foreseeable future. In the current macro-economic climate, how many of our more traditional office users are planning such growth? May I answer…none. But Kool-Aid abounds in the tech sector. If your company had 100 million users, wouldn’t you be drinking?
While the IPO window is open once again, companies like LinkedIn, Pandora and Boingo will pour through. The buzz is viral, of course. It hasn’t taken long for the chatter to infuse lease negotiations. No matter that the 17 million square feet of space on the market in the City has sat for over 26 months, on average; the fact that two or more tenants are vying for the same space has every landlord a flutter. After being held under water for so long, landlords are producing the predictable response: “Pay up.”
Historically speaking, rental rates across much of San Francisco remain cheaper (NOT adjusted for inflation) than in the early 1980s. So, let’s not lose our heads. The bubble-activity isn’t widespread, nor are vacancy rates plummeting. Hype is hype, though, and one must decide whether or not to chase that bus. The activity isn’t just good for some landlords. It’s also good for law firms handling the IPO process, VCs, angels, banks, incubators, and…office leasing brokers.
Dare you drink the new Kool-Aid? Take this reality check:
- Surround yourselves with experts. Take as much care hiring a broker, architect and contractor to advance your interests on the real estate front as you did hiring your CFO. There’s a lot of money at stake…and there are scores of ways to leave it on the table.
- Prepare. Let your real estate team help you define your requirements; establish your budget (all-in, not just for rent); and prioritize your space criterion. Commit a maximum of 8-9% of gross revenue to rent. This litmus test for rent should hold during the entire lease term. Do all of this BEFORE you hit the street touring buildings. [What is nouveau for “haste makes waste”?]
- Do you really have to be in “creative”—brick and timber, loft-style, dog-friendly, high-ceilinged—space? Go back to the prior step and work through your technical / operational / security requirements. Can these requirements be met in the stereotypical “creative buildings”? What premium, if any, are you willing to pay for the privilege of occupying such a building? What else could you do with that money, if you banked the spread?
- Lock down all of your prospective occupancy costs before you sign the Letter of Intent…not after!
- Keep all Team members involved in the lease negotiation process through documentation. There are plenty of potential pitfalls in the lease that will require the attention of your Team to correct before it’s too late.
- If your VC was crazy enough to pay $50/sf/year for space on Townsend Street, should you do the same? Why? How is that responsible to your staff, your exec team and your investors? And how is that budget sustainable?
There remains a heavily favored tenant-market in the San Francisco Bay area. Understand your options. Hire un-conflicted, objective experts to represent your interests. But if you choose to drink the Kool-Aid, please don’t screw up the market for the rest of us.
Mr. Landlord: You Want MORE Space? Pay Me to Leave
There’s enough hoopla coming from the landlord community to drive tenants to wonder “Maybe my landlord would like to buy me out of my space?” After all, if the market has improved so substantially, wouldn’t landlords want MORE space available in their buildings? If the net present value of new deals is so compelling, then let’s see it building owners. Write me a check; buy me out of my lease early and set me free to relocate elsewhere.
Logically, if this were a rising market, landlords wouldn’t want to execute early “blend and extend” deals; rather, they should just pay to terminate the tenant’s lease early and ride your vacant space into a much stronger tomorrow. But are building owners so cock-sure of the current economy? I don’t think so. This is an intriguing litmus test of negotiation wills.
Tenants: Whether you perceive yourselves this way, or not, you put your money where your mouth is every time you sign a lease. At one price you may be willing to renew; at another price, you’ll relocate. What’s your spread? Is your lease an asset or a liability? We can help you figure this out, pronto.
Economic Sustainability Test for Tenants
Just get over it: The landlord community could give a damn if tenants pay too much rent. That’s not their raison-d’être. An office lease is not a partnership agreement.
Sexy the sustainability test is not. But it will save the life of your business. This test has been part of our mantra for the tenant-community since we started representing tenants 28 years ago: Commit less than 8-9% of your gross revenues to rent. Isn’t that simple?! Landlords and tenants are constantly at odds on this front. Landlords (and their brokers, like JLL, CBRE, C&W, The CAC Group, etc.) push rates as high as possible; and typically provide the give-aways (free rent, etc.) at the inception of the lease, leaving tenants to pay artificially inflated rates…just so the landlord looks better to a lender or prospective buyer down the road. Tenants prefer “flat,” predictable rent. Locking in rental rates that are capped at 8-9% of your gross revenue throughout the term of your lease will allow your company economic sustainability.
The sustainability test challenges further, however, when one considers the litany of “pass-through” expenses one’s landlord tries to charge off to tenants. And Prop 13 tax protection is a must-have for all tenants, although virtually every building owner will threaten to implode if tenants don’t swallow this potentially poison pill. Pass-through accounting may be most easily digested when it’s GAAP approved; but nevertheless the pass-throughs are not given by law; they are the product of negotiation, point by point.
To be conservative, tenants may also consider unamortized improvements within the calculation of sustainable rent. Unless you’re in a very high-margin business, hold down that ratio to rent and you’ll be happy that you did. All the way to the bank.
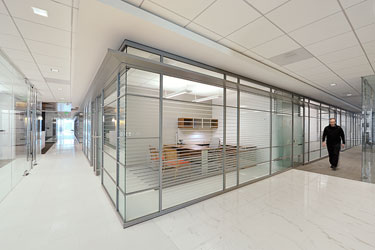
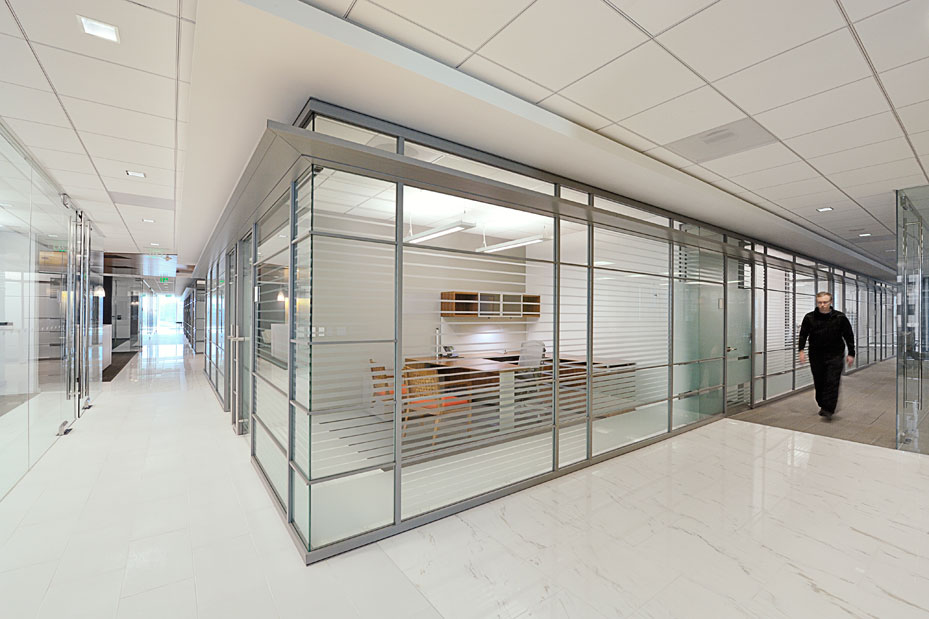
To Attract Social Media/Tech, All Space Is “Creative” Space
Last year I penned an editorial called, “Fundamental Truth: All Office Space Is ‘Commodity Space.’” Since then a provocative marketing movement has evolved in leasing circles, repositioning (putting lipstick on the pig, more likely) such highrise, non-plus, “urban-view” space into “creative” space….to endear the space unto the social media and tech community. How transparent! What is creative about dropped-ceiling space, with 9 foot finished ceiling height, traditional ceiling tiles and the like? If the space provides room for open-landscape workstations, then it must be “creative”, right?! And for that, you’ll have to pay a premium, right?! More hype from the landlord community. But wait—perhaps your architect and contractor can be creative about their approach to “conventional” space, designing elements that evoke openness and embrace natural light, democratic utilization and collaborative work areas. What if you can lease this space at a huge discount to loft-space near the ballpark?!
I’ve asked a few local architects to give me an example of the forethought, planning and execution of a “creative” space inside a conventional 12-foot-slab-to-slab high-rise environment. Here’s the first responder: Doug Mehl, AIA, of Fennie + Mehl Architects:
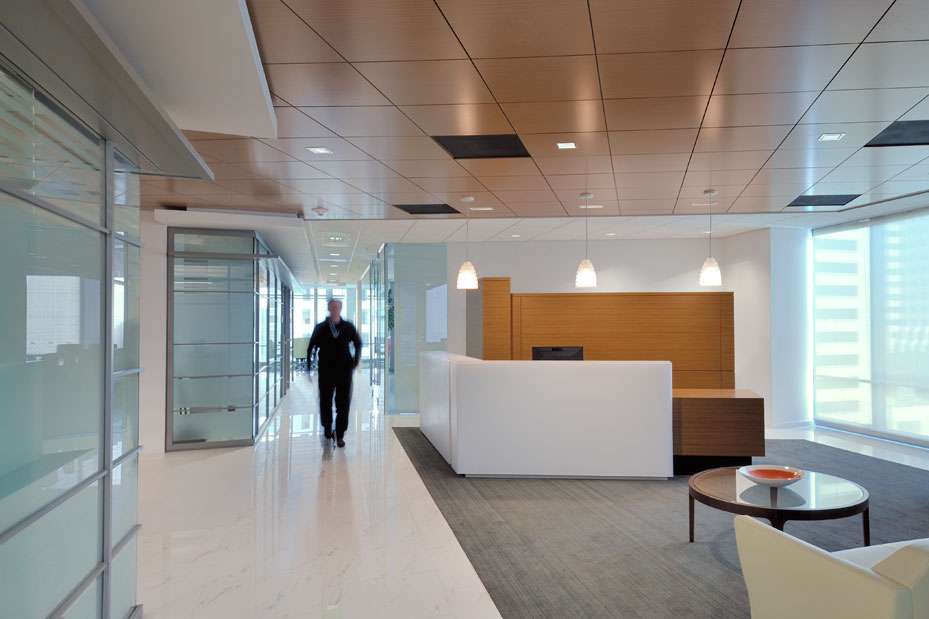
Silicon Valley Bank (SVB), San Francisco, CA

When SVB decided to move their San Francisco operation into two floors of the new stunning high rise office tower located at 555 Mission Street it was with the goal to create a new and cutting edge approach to their banking business model and work style. The inspiration of FENNIE + MEHL Architect’s design comes from the building’s sophisticated exterior glass curtain wall system which provides incredible views of the surrounding city from within the interior space. The project area seems to float within the man made forest of surrounding buildings. Once the visitor passes from urban fabric of the City by the Bay through the building glass walls at the ground floor lobby, and travels to the secured SVB floors, the visitor is once again dazzled by the sophisticated prefab glazed office fronts which encircle the building core. F+M worked closely with the European manufacturer to design a rhythmic pattern for the interior glazing to emulate the exterior glazed curtain wall system.

We were successful in supporting their vision to create a more flexible, mobile work environment by incorporating unassigned private offices to be utilized by visitors and traveling upper management. Various collaboration lounges were integrated into the open office area at the four corners of the office floor with the 9th “executive” floor lounges featuring espresso machines and high-end furnishings to entertain clients and prospective staff. The remainder of the lounges are furnished with plush “toad stool” ottomans and oversized floor lamps adjacent to snack bars stocked with caffeine and fresh pastries for the early-rising traders. The main break kitchen looks out over the South-of-Market neighborhood. We created a spacious kitchen with bar seating to encourage interaction and provide for additional casual meeting space. The adjoining café seating area was designed with a recessed monitor so the staff wouldn’t miss a beat. A portion of the small conference rooms are used as alternative meeting spaces. We outfitted them with marker boards, coffee tables and soft seating as opposed to more formal tables. With our assistance, the staff is equipped with the right mixture of highly productive creative and collaborative spaces.
This project incorporated many sustainable design features and was awarded a Gold certification for interior design and construction under the USGBC LEED rating system. The design achieved maximum efficiency for the mechanical, electrical and plumbing systems. For example, the lighting layout achieved 35% efficiency above the already strict California energy standard. All materials selected for the space were carefully reviewed for their environmental impact (high recycled content, low-emitting, etc.) The design’s use of glass for rooms along the perimeter provided an opportunity for natural light and unobstructed views of the city below.
A trading room for 18 trading stations in a separately secured area was incorporated along the north end of the space on Floor 9. The location was selected to provide a highly visible client-facing room for presentation to select customers.

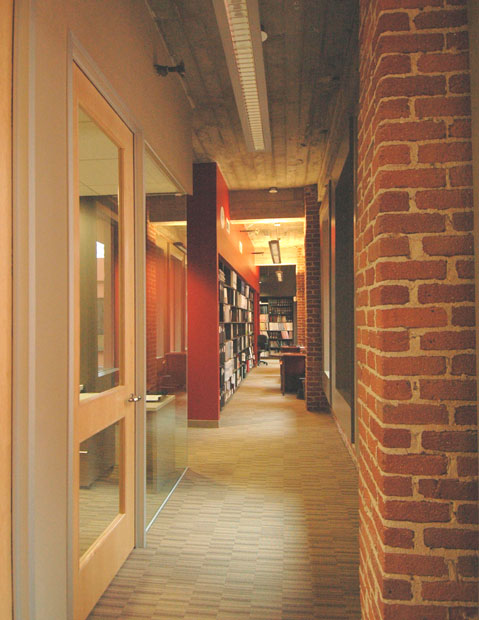
Harb Levy & Weiland LLP
Located at The Landmark at One Market Street, Harb, Levy & Weiland LLP is one of the country’s top certified public accounting and consulting firms that provides tax and consulting services to investment advisors and securities partnerships worldwide.
Developing a highly creative space in a 12'-0" slab to slab San Francisco office building for this 20,000 RSF build-out was a high priority for our forward thinking client. To achieve this goal the design team focused on exposing the existing shell and core exterior walls and removing the cladding of the concrete columns to lend a natural organic framework to the space. Numerous cloud-like suspended acoustic ceilings were designed and punctuated with large linear gaps to expose the overhead concrete structural slab and increase the space’s volume, which is further emphasized through the use of suspended indirect/direct energy efficient light fixtures that highlight the ceilings. A spacious and welcoming reception lobby flows into the board room and conferencing area through a series of large 6'-0" x 9'-0" center pivoting glass and cherry wood doors allowing daylight to penetrate the space and increase the feeling of openness. Extensive use of frameless glazing at private offices along with the inclusion of environmental sustainable building materials, such as bamboo flooring, white carrara marble, carpets woven in subtle organic patterns, low VOC paints and FSC millwork, all work to bring a warmth and sophistication to the interior. The result is a very open and contemporary collaborative workplace environment that enhances both productivity and overall employee moral.

Vacancy Rates: Are Your Options Fading?
Tenants should watch carefully to detect how and to what extent your field of options changes. Which size blocks of space are getting leased? Discussing vacancy and absorption rates can be confusing to some. What language makes sense to tenants? Tenants ask, “Tell me about my specific options. How many choices do I have?” Are your options fading, as a result of leasing activity? Review the chart, below, and let’s discuss.
Please note: We provide Bay Area market data and analyses for the current year only. To request commercial real estate market data for previous quarters, please contact us.
You can request a free space survey, containing all direct and sublease space meeting your specific requirements. We can also provide building photographs, floor plans, leasing histories and more. You’ll receive your survey within one business day. To discuss your space needs in person, call 415-434-2820 or email dan@TheSpacePlace.net.
Robert Reich. Is it All About the Election? What About the Economy?
Former Labor Secretary, Robert Reich, offered his wake-up call recently in his column, “Why Washington Should Pay Attention to the Economy Here and Now”:
All over Capitol Hill Republicans and Democrats are debating spending caps and automatic triggers, and whether to begin them before or after Election Day. But if you don’t mind my asking, what about the economy? I’m not talking about the economy five or ten years from now, when projections show the federal budget wildly out of control or when foreigners might start dumping dollars. I’m talking about the here and now economy — the one Americans are living in day to day.
The Labor Department reported that unemployment for April was 9 percent, up from 8.8 percent in March. And that doesn’t include people working part-time who’d rather have full-time jobs. Yes, 244,000 jobs were added in March — but that’s chicken feed. We’d need 300,000 a month, every month for the next five years, simply to get unemployment back under 6 percent.
And the percent of working-age Americans actually working — 64.2 percent — hasn’t improved. It’s almost as low as it was in the depths of the recession. 13.7 million people remain out of work.
Hello Washington?
Even for Americans with jobs, wages are going nowhere. Basically, the only employers hiring are paying peanuts. McDonalds is hiring big time.
In fact, there’s reason to worry we’re heading back toward recession. The Labor Department also reports new claims for unemployment insurance soared to 474,000 last week.
In the first quarter of this year the U.S. economy slowed to a crawl — a measly 1.8 percent annualized growth — down from over 3 percent last fall. Higher gas and food prices are putting even more squeeze on American households.
And housing prices continue to drop.
Washington is fighting over how much to cut spending over the next ten or twelve years.
But right now we need more public spending to get people back to work, stronger safety nets to help those who have lost their jobs or can’t find new ones, lower payroll taxes on average workers, and a requirement that Wall Street banks renegotiate mortgage loans so Americans can keep their homes.
Why isn’t Washington paying attention to what most Americans need in the here-and-now economy?
Because the White House and congressional Democrats don’t dare admit how bad the economy continues to be for so many people. They’re holding their breath, hoping the recovery catches fire next year before Election Day.
Republicans don’t dare admit how bad the economy is because they don’t want to increase public spending or strengthen safety nets. And their patrons on Wall Street don’t want to modify mortgages. Republicans would rather Americans believe their big lie that taming the deficit will create jobs and restore the economy.
So Washington would rather fight over the long-term budget, spending caps, taxes, and trigger mechanisms than do something about the pain most Americans are experiencing today.
But the here-and-now economy is the most important thing on Americans’ minds.
Ironically, Washington’s disregard for what’s happening right now is also worsening the long-term budget problem. That problem is not the debt per se; it’s the ratio of debt to the overall economy. If the economy sputters or continues to grow at a snail’s pace, that ratio becomes worse and worse.
Financial Repression. Negative Real Returns. Just Another PIMCO Day.
Take this with a strong cup of coffee.
PIMCO’s recent 40th annual summit of global economic leadership offered up sobering conclusions. What do the next three to five years hold for the global economy and markets? We’ve posted the entire article (pdf) at the conclusion of these highlights:
The focus of the conference: What is likely to happen rather than what should happen.
The Context
We argued that the process would involve two distinct sets of dynamics: Advanced countries — and particularly the finance-dependent ones (and, importantly, the U.S.) — would experience unusually sluggish economic growth, persistently high unemployment, public debt and deficit issues, increased regulation, and continuous pressures for private sector deleveraging. Meanwhile, emerging economies would maintain their development breakout phase, registering high growth rates and continuing to close the income and wealth gap relative to advanced economies.
In painting this medium-term picture, we also acknowledged issues of stability — or to be more specific, potential instability. Indeed, the image that came to our mind last year was that of a car traveling on a bumpy road, to an uncertain destination, and driving on a spare tire.
Part of the three- to five-year secular horizon has elapsed and developments have been consistent with this new normal characterization. For example,
- The ongoing G-7 recovery is relatively sluggish, both in overall terms and relative to history;
- The unemployment rate in the G-7 has surged and, despite a fall in the labor participation rate in some countries, now exceeds that of emerging economies;
- Deficit and debt indicators have worsened significantly, in absolute terms and relative to emerging economies; and, in a major change for those that remember the old days,
- The average market risk spread on advanced economies now exceeds that on emerging economies.
These realities are playing out notwithstanding bold policy reactions in advanced countries aimed at mitigating them and delivering a more “normal” recovery. Indeed, for most of the post-crisis period, policymakers (particularly in the U.S.) have been fixated — and understandably so — on stimulating growth through aggressive fiscal and monetary policies. Indeed, some policymakers have even embraced explicit initiatives to boost asset prices, driving a significant wedge between economic fundamentals and turbo-charged asset valuations.
This is not just about the dramatic measures undertaken in 2008—09 to avoid a global depression and normalize markets (such as America’s QE1 (Quantitative Easing 1), TARP (Troubled Asset Relief Program), and an almost $800 billion fiscal stimulus). It is also about what followed — be it QE2 (Quantitative Easing 2), the December 2010 U.S. fiscal package or Europe’s willingness to use every balance sheet available to bail out three of the peripheral economies (Greece, Ireland and Portugal).
While the impact on Main Street in America and Europe has repeatedly fallen well short of policymakers’ stated expectations, the unconventional policy actions were consequential for markets. In particular, they suppressed real interest rates, thus pushing investors all over the world out the risk spectrum and contributing to an impressive rally in global equities, emerging market bonds and currencies, and high yield and investment grade corporate bonds.
Yet this policy initiative — to deliver “good” asset price inflation so that people would feel richer and spend more — also delivered “bad” inflation as commodity prices surged, imposing a tax on both input prices and consumers. As a result, policymakers risk being sucked in even deeper into a “portfolio management conversion” — now trying to differentiate between good and bad asset price inflation.
While on the topic of collateral damage and unintended consequences, the last 12 months also saw a series of improbables — if not unthinkables — become reality, thus speaking to the bumpiness of the journey and the different destination.
S&P placed America’s sacred AAA rating on negative outlook. The possibility of default and debt restructuring in Europe’s periphery became a topic of active discussion notwithstanding the core’s willingness to make fiscal transfers and also contaminate the balance sheet of the ECB (European Central Bank) and IMF (International Monetary Fund). Commodity prices surged despite sluggish growth in advanced economies. And the dollar depreciated sharply even with the uprisings in the Middle East, Europe’s debt crisis, Japan’s tragic calamities, and emerging economies’ attempts to stop the appreciation of their currencies.
Fortunately, these were not the only notable developments. The global economy has progressed in its post-crisis healing, albeit in an uneven and costly manner. Across geographical borders, some sectors (led by multinationals) became stronger than they were before the crisis; witness their powerful balance sheets, large cash holdings, and record profit levels. And unemployment in some countries reached lows not seen for years (e.g., Germany) and, in some cases, recorded history (e.g., Brazil). And millions of people continued to pull themselves out of poverty in China, India and other emerging economies.
Finally, the role of social media and other communication advances (such as cloud computing) has also been notable. On the economic front, these ever growing phenomena have reduced certain input prices and barriers to entry (e.g., through the pooling of IT resources). Socially, they have helped lower coordination problems in repressed societies, creating dramatic tipping points (e.g., the role of Facebook and Twitter in the Egyptian and Tunisian revolutions). And politically, they have widened the gap between struggling “old media” and surging “new media,” adding to political polarization due to ever growing blood sport tendencies and more embedded tribe-like behavior among political partisans.
For the Main Findings…read the entire article.
Who Has the Most Incentive to Drive Up Rental Rates In San Francisco?
When we approach a prospective new tenant client, we tell them that we NEVER represent landlords, always avoiding this conflict of interest. So, which of our competitors—leasing firms—do the most landlord representation? Who’s marketing the most space in San Francisco?
Below we’ve surveyed the entire 113 million square foot inventory of San Francisco, and illustrated the Top 25 companies listing the most space on the market. Of the top 9 companies, 8 are office leasing brokerage firms, controlling 65% of the City’s vacancy!
These brokerage firms are beholden to more than 400 local landlords, paid to drive up rental rates and drive down concessions for tenants.
Since their allegiance is committed to so many landlords, how can they possibly represent YOUR interests—the tenant’s interests—objectively and aggressively?
The top brokerage companies on the list control more of the City’s vacancy than Tishman Speyer, Shorenstein, RREEF, Boston Properties and Hines. Surprised, are you not?
| % Market Share | Square Feet | # of Landlords/ Buildings | ||
|---|---|---|---|---|
The % in the chart below refers to the percentage of vacant space under exclusive listing by each company. The accompanying figure is the actual square footage available for lease. We have also noted the number of landlords / buildings represented by each entity. * Denotes listing brokers. All other companies listed are landlords/developers. |
||||
| 1 | *The CAC Group | 14.4% | 3,038,879 | 63 |
| 2 | *Cushman & Wakefield of California | 9.8% | 2,073,237 | 59 |
| 3 | *Jones Lang LaSalle | 8.6% | 1,806,595 | 35 |
| 4 | *Cornish & Carey Commercial Newmark Knight Frank | 7.5% | 1,590,017 | 40 |
| 5 | Shorenstein Company, LLC | 7.0% | 1,481,179 | 10 |
| 6 | *Grubb & Ellis | 6.0% | 1,263,437 | 66 |
| 7 | *Colliers International | 4.8% | 1,005,539 | 78 |
| 8 | *CB Richard Ellis | 4.3% | 910,156 | 26 |
| 9 | *Kidder Mathews | 3.0% | 623,865 | 38 |
| 10 | Tishman Speyer | 2.5% | 537,476 | 4 |
| 11 | TMG Partners | 2.1% | 447,892 | 2 |
| 12 | Boston Properties Limited Partnership | 1.9% | 393,276 | 4 |
| 13 | Hines | 1.7% | 361,025 | 7 |
| 14 | Beacon Capital Partners, LLC | 1.5% | 307,000 | 1 |
| 15 | McCarthy Cook & Co. | 0.9% | 197,796 | 3 |
| 16 | The Presidio Trust | 0.9% | 189,970 | 44 |
| 17 | *TRI Commercial / CORFAC International | 0.8% | 173,469 | 52 |
| 18 | *Cassidy Turley BT Commercial | 0.7% | 140,382 | 20 |
| 19 | *Starboard TCN Worldwide Real Estate | 0.6% | 122,410 | 53 |
| 20 | *Sansome Street Advisors | 0.5% | 105,386 | 9 |
| 21 | JRT Realty Group, Inc. | 0.4% | 90,035 | 1 |
| 22 | American Assets, Inc. | 0.4% | 77,685 | 2 |
| 23 | *Colton Commercial & Partners | 0.4% | 75,2609 | 20 |
| 24 | Sperry Van Ness | 0.3% | 69,217 | |
| 25 | QAV Realty Services | 0.3% | 66,769 | |
| Total | 21,112,856 | |||