


Market Insight Editorial & Advice to Tenants: 3Q2008
In this Issue:
- Editorial from Dan Mihalovich, Principal of Mihalovich Partners and Founder of The Space Place®
- San Francisco Market Overview
- Take Me Straight to the Numbers: San Francisco Bay Area Rental Rates. Supply / Demand.
- Who Has the Most Space in San Francisco? Surprise…
Editorial from Dan Mihalovich, Principal of Mihalovich Partners and Founder of The Space Place®
If you’re a commercial tenant in the San Francisco area, you’ve come to the right place, The Space Place®. If you are a first-timer at our site, know that we are totally and unequivocally committed to serving and representing the tenant community—and that my Editorials are not only meant to be instructive; they are a written record of our market analyses and recommendations; and, from my perspective, an easy way for you to differentiate the quality of our thinking and strategy with those of our competitors.
We Called The Market Right—And So What?
Did your leasing broker?
Companies hire office leasing brokers for a lot of different reasons, but few choose brokers for what really counts: understanding and articulating (in writing) what’s driving the local and national economy and using that knowledge effectively during lease negotiations to extract greater concessions from landlords than other brokers can. We’ve been bearish for over two years, a rather unpopular opinion within the landlord and brokerage community 12-24 months ago. Now, everyone is a believer. If Management of your company is led through negotiations by a broker well-grounded in the fundamentals of supply/demand economics, one who can argue sensibly and aggressively with the landlord community—your leasing transaction results will stand head and shoulders above other transactions negotiated simultaneously by other tenants.
Landlords must be compelled to provide concessions. If your broker is distracted by conflicts; underpowered relative to the professionals on the landlord’s side; effectively diluted by trying to handle too many deals at one time; you will pay the ultimate price by locking in a long-term losing transaction.
If you didn’t hire a well-equipped, highly experienced, shrewd negotiator to conduct your space search and negotiations on your last round, please give us a read: We’ve been publishing our advice to tenants and market opinions for 10 years. Our 40 letters of recommendation also speak to our level of advocacy. We act as your fiduciary; advancing your interests, saving and making you money and creating aggressive concessions for you are all paramount.
It was three years ago we wrote: “10 Billion Doughnuts Can’t Be Wrong… The investment community is out there right now, armed with billions upon billions of investment dollars—shopping for trophy buildings, REIT portfolios, corporate buyouts—all with cheap-interest money; foreigners with cheap dollars; and banking on sugar-coating and repackaging these investments to deliver to your front door. Never mind that the numbers don’t make sense. It’s the sizzle, friends, that sells.”
The credit meltdown could cost our economy $100 billion…or $200 billion. No one knows, yet, that’s for certain. There are a myriad of certainties, however—many of them simply gory-bloody:
The commercial real estate markets will follow the economy. It’s the consumer and commercial tenants who will dictate the plight of the commercial real estate markets—NOT building owners—no matter how much landlords paid for their buildings. The market fundamentals will always prevail, over time. Temporarily, over-bought highrise markets are rife with deep-pocketed investors. But when consumers pull the plug on 70% of the economic engine in this country, then retail, manufacturing, marketing, advertising and the rest of the chain will follow. What is left to support current rental rates in office markets except “asking rates” and misguided tenants willing to pay more than they should? Interest rates must remain low to prevent a deep recession or depression—although clear signs of depression have appeared in some areas of the country. The dollar has been in a free-fall, and will remain depressed as long as interest rates maintain current levels of decline. Inflation, which we’ve argued in this column many times has been grossly under-reported by the Gov’t, is on the rise…which bites into consumer spending and hiring. Value of the dollar lost 14% vs. Euro in 2007; the dollar lost 23% vs. Euro since 2006; the dollar lost 48% vs. Euro since 2004. How about GDP forecasts for 2007? 2.1%, the lowest growth rate since 2002—when it was 1.6%
The published losses and write-downs in the lending and investment arenas are staggering. The press and legislators are transfixed over the subprime crisis. But 70 million American homeowners have adjustable-rate mortgages turning within the next few years. The credit problem is far greater than a subprime blip. Will the end-investors sit quietly while returns tank? Hardly. Billion dollar lawsuits will follow. We’ll begin to hear more reports on the sea of leveraged acquisitions of commercial real estate around the country—acquisitions founded on flaky underwriting. What could be flakier than “conservative investing” in highrise brick and mortar based on rents which don’t exist in today’s market?
Taking the credit-crisis topic to another level, have a look at credit card debt: $915 billion of UNSECURED loans. Credit card losses. Is this ethical lending? According to Peter Gumbel of Fortune, “credit card debt is different from subprime debt…: Unlike mortgages, credit card debt is unsecured, so a default means a total loss. And while missed payments are at a historical low, they show signs of an uptick: The quarterly delinquency rate for Capital One, Washington Mutual, Citigroup, J.P. Morgan Chase, and Bank of America rose an average of 13% in the third quarter, compared with a 2% drop in the previous quarter. What’s more, consumers and the people who market financial services to them may not have learned their lesson…If there is an international precedent the U.S. should be watching, it’s actually that of the U.K. British consumers are just as overstretched as Americans, but since the real estate market there rose faster and fell earlier, they’re about 18 months ahead in the credit cycle. Since the last quarter of 2005, credit card delinquencies and charge-off rates in Britain have risen as much as 50%, forcing banks to take huge write-offs. It’s a sign of the times that, according to one survey last month, 6% of British homeowners have been using their credit cards to pay their mortgages. That’s suicidal, of course, given that credit card interest rates are more than double even the heftiest mortgage. Keep your fingers crossed that it’s not a trend that crosses the Atlantic.”
Economic Apocalypse: What’s Next?
It was a year ago that we wrote: “Credit-Pandemic: More Bad News You’ll Soon Forget”…but the financial apocalypse that has swept the planet has rooted itself more deeply than anyone fathomed. All the pundits have shown up to be counted—after the fact—to explain the obvious, how we got here. To CEOs and other business owners trying to deal with today’s calamities and tomorrow’s plan, to what end are any of the explanations without an understanding of the credit markets, the banking system and the unregulated $60 TRILLION credit default swap market?
The utter confusion in Washington is broadcast 24/7 for all to see. Financial and other industries have not only seized; the economy has no legs to stand on. Investors and consumers don’t understand the root of our economic woes; worse, they don’t understand the questions. How can our government bring stability to an economy grounded in quicksand?!
Some economists are still taking air time to debate whether or not we’re actually in a “recession”. How foolish. Trillions of dollars of prospective bailout money is on the table; Detroit’s stalwarts are going broke; many of our largest banks, retail chains, insurance companies and mortgage companies have failed; millions are losing their jobs as unemployment rates head to 15%.
The prospects for Depression are here, or near. Q3 GDP was marginally negative, but Q4 will likely be a shocker. [“Depression”, defined by some economists, is a recession that lasts longer and has a larger decline in business activity. Others economists suggest that a Depression is any economic downturn where real GDP declines by more than 10 percent. The worst recession in the last 60 years was from November 1973 to March 1975, where real GDP fell by 4.9 percent.]
In the world of commercial real estate, the days of reckoning for the landlord community have arrived—and it’s particularly ugly. For tenants (100% the focus of our representation business), the proverbial door is wide open —as needed— for early renegotiations; the return of lease assumptions; growing incentives to cover buildout costs, including allowances for architectural fees, moving expenses and other soft-costs; and reductions in securitizations for leases.
Here is our advice to the tenant community: “Advice to Tenants: How to Survive the Big Ugly”.http://www.thespaceplace.net/news/20081029-bigugly.htm. We hope that you’ll find our advice to be extraordinary. If your company can use our leadership, please let us know and we’ll respond immediately.
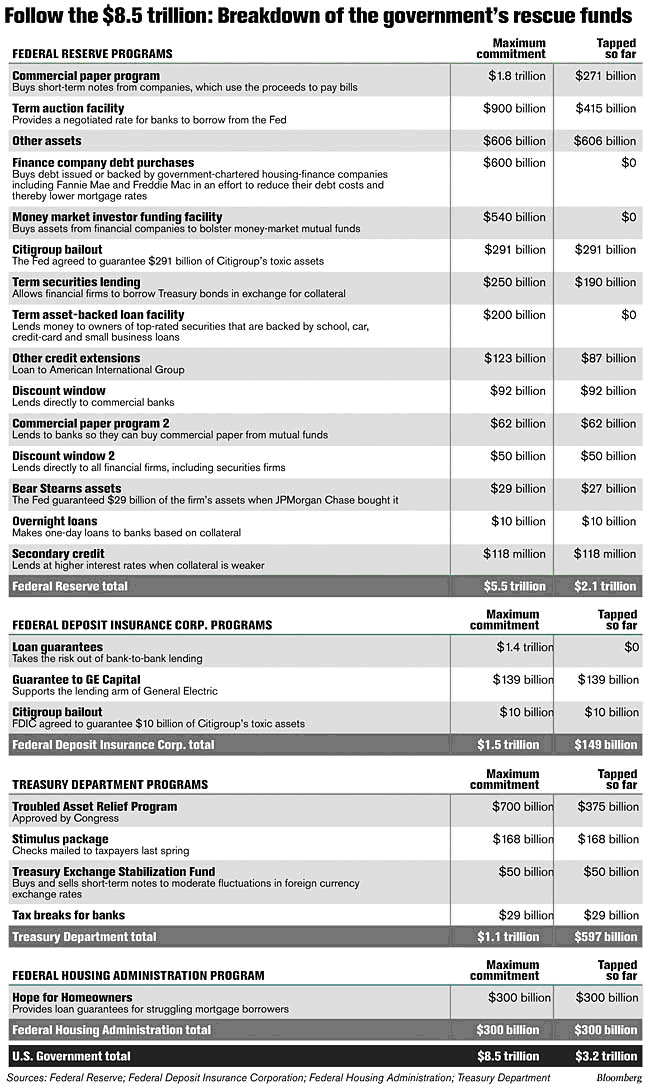
$8.5 Trillion “Rescue”: Printing Money Without End
With thanks to Bloomberg for the chart following, here is a recent graphic portrayal of who is to be rescued, bailed out, guaranteed, stabilized, etc., and to what extent. At this magnitude, is it appropriate any longer to call these “rescue funds”? Perhaps we should call them “generation funds”, since we appear to have hocked our economy for generations to come. If the bill soars another $15-$20 trillion, will the gov just print it? Fears of inflation to the wind, the global “solution” to the financial collapse is to flood the planet with money. But until you get yours, if ever, you’re on your own.
The free-market landscape in the U.S. has been upended. This defines the belly ache amongst most of us. Our business paradigm has changed; all assets are being re-priced—including human assets. Market-purists understand this notion: Never say “The market CAN’T ________”. The market WILL seek its own level according to fundamentals. Down to earth in local San Francisco commercial office space, what is space worth? Well, tenants, what can you afford? At what rental rates and terms can you ASSURE your board, partners or shareholders that your business will survive and grow? THAT is what space is worth. We envision rental rates drifting back to those years when the TOP of the market was $40/s.f./year, fully serviced, for unobstructed Bay view space.
Legendary Corporate Giants Double-Dead
Somewhat akin to the WOT (War On Terror), from our seats in the San Francisco Bay Area, many among us have not fully grasped the carnage on the financial battle fields of Wall Street, London, Berlin, Tokyo, and elsewhere. That is, until now.
In our negotiating experience, we’ve oftentimes revived “dead” deals.to everyone’s surprise. Consider some of the airlines and others who’ve emerged from Chapter 11 to live again. But “double-dead” is dead forever, and so expired Bear Stearns, Lehman Brothers, Merrill, WaMu, Wachovia, IndyMac, Countrywide, Downey Savings, National City Bank and scores of other majors around the world. Then fell Heller Ehrman and Thelen, two of San Francisco’s most revered law firms. The press has uncovered testimonials from former partners and staff, surprised and saddened by the turn of events. But we didn’t notice any analysis into the leveraging upon which these businesses evolved and finally imploded. Were there not remarkable similarities between the failures of all of these business entities?
Virtually all of us are touched, locally, by the fallout. Market dynamics will crush every credit-amped business. Your company’s raison-d’être depends on removing speculation from your business plan. But too many companies are already in too deep.
Citigroup and GE required bailout funds.unimaginable. Citigroup lost over $20 BILLION during the past year and have written down more than $50 BILLION in bad loans during that period. The Dutch bailed out ING with over $13 BILLION. The Big Three auto companies are about to run out of cash.and do you believe their problems are centered around Detroit?
190,000 people in California work in the auto trade, second only to auto jobs in Michigan.
Retail, multi-housing, office and speculative development is essentially dead. Investment banking, as we knew it, is dead. Service firms ancillary to those and other troubled industries are struggling to reinvent themselves and new client bases.
Big Name Retailers on the Edge, or Fallen:
- Ann Taylor 117 stores nationwide closing
- Bombay closing remaining stores
- Cache will close all stores
- Circuit City (filed Chapter 11)
- Dillard’s to close some stores
- Disney closing 98 stores and will close more after January.
- Eddie Bauer to close stores 27 stores and more after January
- Ethan Allen closing down 12 stores.
- Footlocker closing 140 stores more to close after January
- GAP closing 85 stores
- Home Depot closing 15 stores
- J. Jill closing all stores (owned by Talbots)
- JC Penney closing a number of stores after January
- K B Toys closing 356 stores
- Lane Bryant, Fashion Bug, and Catherine’s to close 150 stores nationwide
- Levitz closing down remaining stores
- Linens and Things closing all stores
- Loews to close down some stores
- Macys to close 9 stores after January
- Movie Galley closing all stores
- Pacific Sunwear (also owned by Talbots)
- Pep Boys closing 33 stores
- Piercing Pagoda closing all stores
- Sharper Image closing down all stores
- Sprint/Nextel closing 133 stores
- Talbots closing down specialty stores
- Whitehall closing all stores
- Wickes Furniture closing down
- Wilson Leather closing down all stores
- Zales closing down 82 stores and 105 after January
Office Leasing Crime
Did your commercial leasing broker and their firm knowingly misrepresent the stability of the market as they led you through negotiations to sign a now grossly- over-“market” lease?
In 26 years of representing tenants in leasing negotiations, I don’t believe this question has been asked around town. But with all the scandals from Wall Street (thinking as far back as Milken) to the White House (Nixon and many others come to mind), one should wonder how it is that the industry of commercial real estate transactions is so utterly unregulated (tenants are really in the dark).
Is it possible—or likely—that a leasing broker in a brokerage firm so beholden to so many landlords could negotiate an extraordinarily beneficial deal for a tenant-client? Think about it.
San Francisco Market Overview
Vacancy Rates: Are Your Options Soaring?
Landlords, their listing brokers and developers dance to the tune of lower vacancy rates, so tenants should watch carefully to detect how and to what extent your field of options changes. Which size blocks of space are getting leased? Discussing vacancy and absorption rates can be confusing to some. What language makes sense to tenants? Tenants ask, “Tell me about my specific options. How many choices do I have?” Your options are soaring, as a result of recent poor market performance. Review the chart, below, and let’s discuss.
Here’s an intriguing statistic for you. BET YOU’LL BE BAFFLED: In Q2 of 2001, Bay Area Counties had a supply of 42 million square feet available for lease on the market. Today the Bay Area markets have 53 million square feet on the market. Tenants in San Francisco have a LARGER number of parcels to choose from in today’s market than in Q2 of 2001—the period just before our markets crashed. Today the trend for absorption has turned “down”…and the stats should give you reason to wonder—what kind of Kool-Aid has the landlord community been drinking? [In Q2, 2001, there were only 202 parcels of spaces available in San Francisco in the 5-10,000 sf range; 173 parcels in the 10-20,000 sf range; and only 67 parcels in the 20-40,000 sf range.]
Please note: We provide Bay Area market data and analyses for the current year only. To request commercial real estate market data for previous quarters, please contact us.
You can request a free space survey, containing all direct and sublease space meeting your specific requirements. We can also provide building photographs, floor plans, leasing histories and more. You’ll receive your survey within one business day. To discuss your space needs in person, call 415-434-2820 or email dan@TheSpacePlace.net.
Tenants: Get It Straight
Mihalovich Partners represents tenants, only. Our core business is driven toward educating and objectively and aggressively representing TENANTS, only. If you are looking for biased market information serving the LANDLORD community, please see one of The CAC Group; Cushman & Wakefield; CB Richard Ellis; Grubb & Ellis; Colliers; or Jones Lang LaSalle—whom collectively represent over 54% of the 13.2 million square feet of space currently on the market. Those six firms have pledged their allegiance to over 300 local landlords.
Strange as it may seem, bearing in mind their conflicts of interest, we compete with them every day for YOUR business—for the opportunity to represent you, the tenant, in leasing negotiations. CAC, C&W, CB, G&E, Colliers and JLL control more space than any landlord in San Francisco. Mihalovich Partners’ business and approach is diametrically opposed to that of brokers who represent landlords. Are you, the tenant, looking for advice and counsel? You can count on straight talk from us. Advice for tenants, pure and simple. Serving the tenant community in San Francisco for 25 years.
Dan Mihalovich (dan@TheSpacePlace.net)
Principal of Mihalovich Partners and Founder of The Space Place®
Take Me Straight to the Numbers: San Francisco Bay Area Rental Rates. Supply/Demand.
Please note: We provide Bay Area market data and analyses for the current year only. To request commercial real estate market data for previous quarters, please contact us.
Who Has the Most Space in San Francisco? Surprise…
When we approach a prospective new tenant client, we tell them that we NEVER represent landlords, always avoiding this conflict of interest. So, which of our competitors—leasing firms—do the most landlord representation, and who controls the most space in San Francisco? And, most importantly, why would you feel comfortable having them represent YOU?
Below we’ve surveyed the entire 110 million square foot inventory of San Francisco, and illustrated the companies with the most control of space on the market, the Top 25. You know from our other stats that 15.68 million square feet is now on the market in San Francisco. Of the top 7 companies, ALL are office leasing brokerage firms, controlling 58% of the City’s vacancy! These brokerage firms are beholden to more than 300 local landlords. Since their allegiance is committed to so many landlords, how can they possibly represent YOUR interests—the tenant’s interests—objectively and aggressively? The top brokerage companies on the list control more of the City’s vacancy than Tishman Speyer (#9); Shorenstein (#12); RREEF (#11); Hines (#10); and more than Boston Properties (#13). Surprised, are you not? In the case of Studley, our friendly tenant-representation competitor, they represent over 110,000 square feet of space available in 11 different buildings. How can they objectively represent YOU, the tenant, if you choose to pursue any of their sublease space?!
| % Market Share | Square Feet | # of Landlords/ Buildings | ||
|---|---|---|---|---|
% Refers to the percentage of vacant space under exclusive listing by each company. The accompanying figure is the actual square footage available for lease. We have also noted the number of landlords/buildings represented by each entity. * Denotes listing brokers. All other companies listed are landlordselopers. |
||||
| 1 | *The CAC Group | 12.2% | 2,334,310 | 54 |
| 2 | *Jones Lang LaSalle | 12.0% | 2,297,032 | 28 |
| 3 | *CB Richard Ellis | 8.1% | 1,551,043 | 30 |
| 4 | *Cushman & Wakefield of California | 7.9% | 1,502,111 | 62 |
| 5 | *Grubb & Ellis | 6.7% | 1,280,860 | 62 |
| 6 | *GVA Kidder Mathews | 5.8% | 1,115,662 | 33 |
| 7 | *Colliers International | 4.8% | 926,936 | 81 |
| 8 | *Cornish & Carey Commercial | 2.7% | 507,009 | 19 |
| 9 | Tishman Speyer | 2.4% | 464,381 | 3 |
| 10 | Hines |
2.3% | 430,808 | 10 |
| 11 | RREEF America LLC | 2.1% | 400,000 | 1 |
| 12 | Shorenstein Company | 1.6% | 313,259 | 8 |
| 13 | Boston Properties | 1.5% | 286,280 | 4 |
| 14 | Fremont Development Funding Corp | 1.3% | 250,000 | 1 |
| 15 | *TRI Commercial / CORFAC Intl | 1.3% | 245,574 | 36 |
| 16 | McCarthy Cook & Co | 1.2% | 229,441 | 3 |
| 17 | Retail West | 1.1% | 205,100 | 1 |
| 18 | *NAI BT Commercial | 1.1% | 201,368 | 28 |
| 19 | The Presidio Trust | 0.7% | 143,280 | 76 |
| 20 | JRT Realty Group, Inc. | 0.7% | 140,717 | 1 |
| 21 | *Colton Commercial & Partners | 0.7% | 140,101 | 22 |
| 22 | *Starboard TCN Worldwide Real Estate | 0.6% | 120,076 | 74 |
| 23 | *Studley | 0.6% | 110,182 | 11 |
| 24 | *Newmark Knight Frank | 0.5% | 102,444 | 10 |
| 25 | *Sansome Street Advisors | 0.5% | 100,639 | 10 |
| All Others | 8.2% | 1,568,820 | 619 | |
| Total | 16,767,000 | |||